
Instruction Manual


Rockwell Automation Publication 1412-UM001D-EN-P - September 2012 45
Display Modes Chapter 3
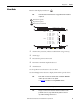
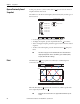
Example when L1 is Selected
MIN, AVG and MAX values over the display period
MAX value
AVG value
MIN value
Returns to the Measurement Selection Screen
See Select a Graphic Display for Recorded Measurements
on page 44.
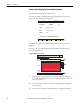
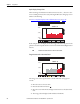
When the display period is different from the averaging integration period:
• The average value is calculated with the sum of each integration period
stored.
• The extreme values are the minimum and the maximum of an integration
period during the display period selected with the cursor.
220.0V
210.0V
200.0V
mn>
Vrms
10 15 20 25 30
204.5204.9
204.7
v
3L
L1
L2
L3
07/25/02 10:38 10 0
%
07/25/02 10:13:21
2
4
1
5
3