User Manual PowerPad Portable Power Monitor Catalog Numbers 1412-PP2127, 1412-PP2137-01, 1412-PP2137-02, 1412-PP2137-03, 1412-PP2137-04, 1412-PP2137-05, 1412-PP2137-06
Important User Information Solid-state equipment has operational characteristics differing from those of electromechanical equipment. Safety Guidelines for the Application, Installation and Maintenance of Solid State Controls (publication SGI-1.1 available from your local Rockwell Automation® sales office or online at http://www.rockwellautomation.com/literature/) describes some important differences between solid-state equipment and hard-wired electromechanical devices.
Summary of Changes This manual contains new and updated information. Changes throughout this revision are marked by change bars, as shown to the right of this paragraph. New and Updated Information This table contains the changes made to this revision. Topic Page Added battery disposal information. 15 Updated the catalog number.
Summary of Changes Notes: 4 Rockwell Automation Publication 1412-UM001D-EN-P - September 2012
Table of Contents Preface Additional Resources . . . . . . . . . . . . . . . . . . . . . . . . . . . . . . . . . . . . . . . . . . . . . . . 7 Chapter 1 Product Features Description. . . . . . . . . . . . . . . . . . . . . . . . . . . . . . . . . . . . . . . . . . . . . . . . . . . . . . . . 9 Control Features . . . . . . . . . . . . . . . . . . . . . . . . . . . . . . . . . . . . . . . . . . . . . . . . . 10 Display . . . . . . . . . . . . . . . . . . . . . . . . . . . . . . . . . . . . . . . . . . . . .
Table of Contents Appendix B Specifications Reference Conditions. . . . . . . . . . . . . . . . . . . . . . . . . . . . . . . . . . . . . . . . . . . . . Electrical Specifications . . . . . . . . . . . . . . . . . . . . . . . . . . . . . . . . . . . . . . . . . . . Mechanical Specifications . . . . . . . . . . . . . . . . . . . . . . . . . . . . . . . . . . . . . . . . . Safety Specifications . . . . . . . . . . . . . . . . . . . . . . . . . . . . . . . . . . . . . . . . . . . . . .
Preface Additional Resources These documents contain additional information concerning related products from Rockwell Automation. Resource Description Industrial Automation Wiring and Grounding Guidelines, publication 1770-4.1 Provides general guidelines for installing a Rockwell Automation industrial system. Product Certifications website, http://www.ab.com Provides declarations of conformity, certificates, and other certification details. You can view or download publications at http:/www.
Preface Notes: 8 Rockwell Automation Publication 1412-UM001D-EN-P - September 2012
Chapter 1 Product Features Description The PowerPad portable power monitor is a three-phase power quality analyzer that is compact and shock-resistant. It is intended for technicians and engineers to measure and carry out diagnostic work on one, two, or three phase low voltage networks. You are able to obtain instant waveforms of an electrical network’s principal characteristics, and also monitor their variation over a period of time.
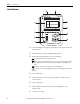
Chapter 1 Product Features Control Features 6 5 PowerPad™ 49.99Hz 07/25/02 1 0.3 v 0.3 v 2 10:26 3 100% 0.3 v 300V 3U 3V 3A L1 L2 L3 1 0 -300 7 8 max min 2 9 3 10 ? W 4 Color LCD display with graphic representation of system parameters and measurements. Six function buttons used to modify the display mode. Four function buttons which let you to the following: – Access the instrument setup parameters.
Product Features Chapter 1 Enter button and four buttons that enable movement of the cursor, browsing or the selection of data. Buttons for directly accessing the six display modes at any time: • Transients (set recording or view recorded transient): – Displays waveforms such as, motor startup current (INRUSH) and interruptions. • Harmonics View: – Display of the harmonic ratios of voltage, current and power, for each harmonic through the 50th.
Chapter 1 Product Features Display 49.99Hz 1 07/25/02 10:26 1 2 202.5 v 2 202.0 v 3 100% 202.7 v 300V 3U 3V 3A L1 L2 L3 0 3 - 300 max min CF 4 Top display bar indicates: • Symbol of the tested mode (for example, • • • • , , ). Frequency of measured signal. Memory capacity status bar (only available in certain modes). Current date and time. Battery charge status. Measured RMS values associated with waveforms.
Product Features TIP Chapter 1 Protocol: U - Signifies phase-to-phase voltage V - Signifies phase-to-neutral voltage L1, L2, L3 - Refer to the phases (A, B, C, or other) Battery Charge Status Battery Status Battery Indicator Battery Charging ·Battery capacity level relative to full charge ·% of total capacity already charged (between 0 and 99%) ·Battery sign and % are blinking Power Cord Line cord is plugged in.
Chapter 1 Product Features Notes: 14 Rockwell Automation Publication 1412-UM001D-EN-P - September 2012
Chapter 2 Operation The instrument is turned ON by pressing the green power button. The startup screen appears and indicates the instrument's software version and serial number. If there is no AC power supply, the instrument operates on batteries. The instrument's batteries are charged when it is connected to a 120/240; 60/50Hz line. This product contains a sealed NiMH battery which is permanently connected and should only be removed or replaced by trained professionals.
Chapter 2 Operation When the Parameter Setup key is pressed, these setup choices appear. 07/25/02 10:26 100% DATE / TIME CONTRAST / BRIGHTNESS COLORS CALCULATION METHOD ELECTRICAL HOOKUP CURRENT SENSORS BAUD RATE RECORDING ALARM CLEAR MEMORY LINE FREQUENCY Français English Deutsch Italiano Español Portugues ATTENTION: When CLEAR MEMORY is selected, all configurations are deleted. 1. Choose the language by pressing the function button below the chosen language.
Operation Chapter 2 Contrast / Brightness Follow these steps to adjust the contrast and brightness of the PowerPad unit. 1. Highlight CONTRAST/BRIGHTNESS with the Up/Down Cursor buttons, then press Enter. The setting is adjusted with the Left/Right Cursor buttons and the contrast level is indicated on the bargraph. 2. Press Enter to apply the new settings. The Configuration menu is once again displayed on the screen. Colors Follow these steps to adjust the color on the PowerPad unit screen. 1.
Chapter 2 Operation Electrical Hookup (Electrical Network) Follow these steps to select the type of power system the PowerPad unit will measure. 1. Highlight ELECTRICAL HOOKUP with the Up/Down Cursor buttons, then press Enter. This screen appears. 07/25/02 10:26 N L1 100% N L1 L2 Single-phase N L1 L2 L3 Two-phase N L1 L2 L3 3 phase-3 wire (DELTA) 3 phase-4 wire (WYE) 2. Choose the hookup type with the Up/Down and Left/Right Cursor buttons. 3. Press Enter to apply the new hookup selection.
Operation Chapter 2 Table 1 - Synchronization of the Display in Waveform Mode Display Selection (Vertical Right Menu) Reference Channel for Synchronization 3U U1 3V V1 4A / 3A A1 L1 V1 L2 V2 L3 V3 Current Sensors Follow these steps the select the current sensor type. 1. Highlight CURRENT SENSORS with the Up/Down Cursor buttons, then press Enter. This screen appears. 07/25/02 10:26 100% 200A MN clamp SR clamp AmpFlex 1 MR clamp Adapter Current transducer ratio.
Chapter 2 Operation Each press of the Left/Right Cursor buttons moves the highlight one digit to the left or right, accordingly. Use the Up/Down Cursor buttons to change each digit position as desired. The primary range can be set between 1…2999. 3. Press Enter to apply the current sensor selection. The Configuration menu is once again displayed on the screen. TIP In addition to the four current probe choices, there is an adapter selection.
Operation Chapter 2 Set Recording Follow these steps to select which parameters the PowerPad unit records. 1. Highlight RECORDING with the Up/Down Cursor buttons, then press Enter. This screen appears. SET-UP Hz If these options are not selected, all the harmonics (odd and even) are recorded. Four recording set-ups are available. 2. Choose recording configuration 1, 2, 3, or 4 with the Up/Down Cursor buttons. 3.
Chapter 2 Operation Use the same process to select the upper limit. 6. Press the Right Cursor button again to move to the right and modify the last value needed to complete the definition. Here you will choose whether to include all harmonics or only the odd harmonics. 7. Use the Up/Down Cursor buttons to make this selection. The diamond preceding the Odd Only choice will appear filled in for selected and unfilled for not selected. EXAMPLE Example of a user defined choice: Vh 02 15 Odd Only.
Operation Chapter 2 Set Alarm Follow these steps the set the alarms. 1. Highlight ALARM with the Up/Down Cursor buttons, then press Enter. This screen appears. 07/25/02 10:26 1 2 100% 5 Hysteresis 10 % ON 1 Vrms 3L < 210 V 01 s ON 2 Arms 3L < 0020 A 02 s ON 3 Vthd 3L > 0 8.0 % 01 s ON 4 Athd 3L > 1 0.0 % 05 min ON 5 W Σ > 1000 W 15 min ON 6 PF 3L < 0.9 2 01 min ON 7 Vh 3L > 0 5.
Chapter 2 Operation Alarm Programming Choose the parameters associated with an alarm from the available parameters (phases survey, threshold value and minimum duration filtering can be programmed). The programmed hysteresis is common to all alarms. TIP 1. Highlight Alarm with the Up/Down Cursor buttons, then press Enter. 2. Select the modifiable field by using the Left/Right Cursor buttons. 3. Activate or adjust the threshold values by using the Up/Down Cursor buttons.
Operation Chapter 2 Line Frequency Rated frequency of network: 50 or 60Hz IMPORTANT This parameter determines the correction coefficients used for calculating power and energy. 1. Highlight Line Frequency with the Up/Down Cursor buttons, then press Enter. 2. Choose the line frequency by using the Left/Right Cursor buttons. 3. Press Enter to apply your selection. The Configuration menu is once again displayed on the screen.
Chapter 2 Operation Notes: 26 Rockwell Automation Publication 1412-UM001D-EN-P - September 2012
Chapter 3 Display Modes The screen presentations in this section depict three-phase setups for the purpose of explaining the various choices. Your actual screens will appear differently based upon your particular set up. Waveform Mode Press the waveform display mode button - RMS Voltage Measurement on a Three-phase System 49.99Hz 1 07/25/02 10:26 1 202.5 v 2 202.0 v 3 100% 202.7 v 300V 3U 3V 3A L1 L2 L3 0 2 -300
Chapter 3 Display Modes The waveforms are selected by pressing the Up/Down Cursor buttons: – 3U displays the three phase-phase voltages of a three-phase system – 3V displays the three voltages of a three-phase system – 3A displays the three phase currents of a three phase, three-wire system IMPORTANT The neutral current is not a direct measurement, but the resulting total of the 3 currents measured. – L1, L2, or L3 displays the current and voltage, on phase one, two, or three, respectively.
Display Modes Chapter 3 RMS Current Measurement on the Three Phases and Neutral Current on a Three-phase, Four-wire System 60.00Hz 1.2 A N 07/25/02 10:26 19.1 A 1 18.5 A 2 100% 17.1 A 3 27A 3U 3V 4A L1 L2 L3 0 -27 max min CF Total Harmonic Distortion Measurement on One Phase 60.00Hz 07/25/02 10:26 1 2.1 % 2 3.5 % 3 100% 1.9 % 290V 3U 3V 4A L1 L2 L3 0 -290
Chapter 3 Display Modes Minimum and Maximum Current Value Measurements 59.99Hz 07/25/02 10:26 1 2 3 MAX 21.7 18.8 17.6 AVG 6.3 18.5 17.1 MIN 0.0 0.0 0.0 A PEAK+ +11.4 +25.8 +24.0 A PEAK - –11.0 –25.8 –24.8 A 100% N A 15.0 3U 3V 4A L1 L2 L3 A 2 1 RMS THD CF max min Crest Factor - refreshed every 250 ms (but calculated every second) Select 3V or 4 A with the Up/Down Cursor buttons to obtain the MIN, AVG, MAX, or PEAK values for current or voltage.
Display Modes Chapter 3 K factor is only available for currents 4 A, 3 A, or 2 A, depending on hook up. Flicker is only available for voltages 3V or 2V, depending on hook up. Flicker and K factor are available when either L1, L2, or L3 is selected from the choices on the right side of the screen. The DC current will be displayed, however the values are only valid when a current probe capable of measuring DC is used. The MR193 probe is available for this purpose.
Chapter 3 Display Modes Harmonics Mode Press the harmonic display mode button Use the function buttons to select the type of harmonic analysis: • V - Single phase voltage analysis • A - Current analysis • VA - Power and direction flow analysis • U - Phase-to-phase voltage analysis • The Plus and Minus buttons let you zoom in or out, in increments of 2%, 5%, 10%, 20%, 50%, and 100%. Single-phase and Phase-to-phase Voltage Analysis 59.95Hz Vh 03 1 1 07/25/02 10:26 31.5 % 31.4 v +003° 2 1.3 % 2.
Display Modes Chapter 3 Single-phase and Phase-to-phase Current Analysis 60.00Hz Ah 03 07/25/02 10:26 34.1 % 2.8 A max 34.5 % max 1.1 % 100% -040° THD 36.5 % % 50 .
Chapter 3 Display Modes By convention, positive harmonics are from supply to load, and negative harmonics are from load to supply. TIP The signs are only available in harmonic power measurement. The Power and Direction Flow Analysis example shows a power harmonic display with the 3rd harmonic highlighted by the cursor. This harmonic is generated by the load. Harmonic Analysis in Expert Mode Press the Up Cursor button to select -.+ and then either the V or A variable function button V or A.
Display Modes Power / Energy Mode Press the power display mode button - Chapter 3 . This enables the PowerPad unit to do the following: • Measurement of the real power (generated and consumed) • Measurement of reactive power (capacitive or inductive) • Measurement of apparent power – Choice of power parameters PF...
Chapter 3 Display Modes G Button This function key is used to display generated or consumed power, or real, reactive, and apparent energy. This button toggles the display between generated energy (from load to supply) and consumed energy (from supply to load) each time it is pressed. When the G is highlighted (yellow background) the display shows generated energy.
Display Modes Transient Mode Chapter 3 Press the transient display mode button Transients are displayed in the form of waveforms. All channels (up to six, based upon configuration) are stored in memory for each transient. Up to 50 transients can be captured.
Chapter 3 Display Modes This table lists the capture threshold levels, based on the probe in use (for the current channels) and voltage at the different percent selections.
Display Modes Chapter 3 Opening Previously Stored Transients The screen below can be accessed with the retrieve button transients previously stored in the memory. 07/25/02 10:56 . It displays a list 100% 1 SELECTION OF TRANSIENT 2 TEST 05 05/07/02 14:31:41 TEST 04 05/07/02 14:31:41 TEST 03 05/07/02 14:31:21 TEST 02 05/07/02 14:31:04 TEST 01 05/07/02 14:31:04 3 The status bar at the top displays the memory filled by stored transients.
Chapter 3 Display Modes This display shows the transient selected in Opening Previously Stored Transients on page 39. 07/25/02 11:22 100% 07/25/02 11:24:21 30A 3V 4A L1 L2 L3 0 -30A 1 2 3 The screen displays four cycles of 256 points/cycle, with one cycle before the trigger and three cycles after. The waveforms to be displayed are selected by pressing on the Up/Down Cursor buttons.
Display Modes Alarm Mode Chapter 3 Press the alarm display mode button TIP The threshold values must first have been programmed in the instrument setup mode. • Starts alarm capture • Stops alarm capture • Deletes all stored alarms 1 07/25/02 11:27 100% 2 4 < 07/25/02 11:27 11:28 11:29 L1 L1 L1 L1 L1 L2 L1 L2 L3 L1 L1 Vthd Vrms Vthd Vthd Arms Arms Arms Arms Arms Vrms Vthd 23.1% 0V 34.3% 35.0% 1A 1A 0A 0A 0A 109V 35.
Chapter 3 Display Modes Record Mode After a recording is set, the instrument will go into sleep mode (no display) to save the batteries. The recording will start as programmed. Press any button other than the On/Off button to turn On the display again. TIP This mode enables all the parameters previously configured in the setup mode to be recorded. Press the record display mode button . See Set Recording on page 21 for more information.
Display Modes Chapter 3 Select or Delete a Record 07/25/02 10:56 100% SELECTION OF RECORDING TEST 07/25/02 17:58 > In progress PUMP 07/18/02 17:58 > 07/18/02 11:45 MOTORA 07/12/02 14:41 > 07/12/02 16:40 The status bar at the top displays the memory occupied by previous records. • To Select a Recording: Press the Up/Down Cursor buttons to select the recording. The current selection will appear in bold type. Press Enter to accept the selection.
Chapter 3 Display Modes Select a Graphic Display for Recorded Measurements Recorded data can be displayed in graphic form. Select the recording to be displayed by using the Up/Down Cursor buttons. Then, open the recording by pressing Enter. 07/25/02 10:56 TEST RECORDING START : 07/25/02 17:58 END : 07/25/02 18:27 PERIOD : 1 mn 100% (1%) SELECTION OF MEASUREMENT TO VIEW F Urms Uthd Ucf Vrms ../.. Use the function buttons to enable direct selection of the measurement to be displayed.
Display Modes Chapter 3 Example when L1 is Selected 07/25/02 10:38 07/25/02 10:13:21 Vrms 204.5 204.7 v 100% 204.9 1 220.0V 3L L1 L2 L3 210.0V 2 3 200.0V mn> 10 4 15 20 25 30 5 MIN, AVG and MAX values over the display period MAX value AVG value MIN value Returns to the Measurement Selection Screen See Select a Graphic Display for Recorded Measurements on page 44.
Chapter 3 Display Modes Graphic Display of Average Power After returning to the Measurement Selection Screen use the ../.. button to view more recorded parameters, if necessary. Pressing the W button, brings up a screen similar to the following. See Select a Graphic Display for Recorded Measurements on page 44. 07/25/02 10:38 07/25/02 10:13:21 +3.
Display Modes Chapter 3 It is possible to make an energy measurement over several recording ranges in the 4 quadrants. TIP All data in a recording session can be downloaded to a computer by using the DATAVIEW software. The Plus and Minus buttons allow the integration period of the displayed measurement and the graph time-scale to be changed.
Chapter 3 Display Modes Open a Previously Saved Snapshot A short press (about 1 s) on the Camera button snapshots that have been saved. gives access to the menu of The small icon to the left of each snapshot (date and time) tells you what type of data was stored. 07/25/02 10:26 07/17/02 11:27 100% 07/17/02 12:57 07/17/02 11:28 07/17/02 12:08 07/17/02 12:20 07/17/02 12:30 07/17/02 12:48 • Use the Up/Down Cursor buttons to select the snapshot.
Display Modes IMPORTANT Chapter 3 To stop the printing in progress (for example, in the event of an error), press the Print button once again. The recommended printer for the PowerPad unit is the SEIKO Model DPU414-30B. Help Press the Question Mark button to obtain help for the current display mode. To exit the Help mode, press the Question Mark button once again.
Chapter 3 Display Modes Notes: 50 Rockwell Automation Publication 1412-UM001D-EN-P - September 2012
Chapter 4 DATAVIEW Software Introduction The DATAVIEW graphing and analysis program is a full function Windows based application software package. It lets you configure and run any test or recording from the computer as you can from the instrument itself. Additionally, it enhances the information captured for snapshots as it captures all the information to display and report waveforms, and harmonic spectrums of the data captured.
Chapter 4 DATAVIEW Software • Provides consistency in testing, regardless of who performs the test TIP Get Started Minimum Computer Requirements Connect the PowerPad unit to your Computer For help on software instructions, use the DATAVIEW program’s Help Menu, which is located on the menu bar. The DATAVIEW software is supplied on a CD-ROM format. The CD selfinstalls, prompting you along the way for any information that is needed.
DATAVIEW Software Start DATAVIEW Software Chapter 4 Once the serial connection between the computer and the PowerPad unit has been completed, start the DATAVIEW program. There are two ways to open and use the DATAVIEW software: • use the PowerPad unit icon.
Chapter 4 DATAVIEW Software The Quick Start dialog box contains the following options: • Configure Instrument: Opens an instrument specific control panel which displays a Configure Instrument dialog box. This dialog box lets you modify the configuration of the PowerPad unit. • Real-time Display: Opens an instrument control panel providing real-time display of measurement data. • Download Data: Opens an instrument control panel and begins the download of recorded data.
DATAVIEW Software IMPORTANT Chapter 4 The instrument must be configured for the same communications rate specified in the Connections window shown on the previous page. If it is not, then you must either select the corresponding rate or change the instrument's rate. When a serial communication link is established, the DATAVIEW program automatically identifies the instrument that it is connected to. A status screen then appears.
Chapter 4 DATAVIEW Software General Functions The general function buttons appear on several DATAVIEW program setup screens. • Re-read from PowerPad unit: Reads the current configuration of the Power-Pad attached via the serial cable. • Save to File: Saves the current configuration. This file resides on the computer's disk drive. Saving different configuration setups can be useful for future functions and tests.
DATAVIEW Software Chapter 4 • Connection Type: Single Phase, Two phase, Three-phase, three-wire Delta or Three-phase, four-wire WYE • Voltage Transformer Ratio: Sets the scale for voltage measurement in cases where measurements are on the secondary side of a transformer and the primary value needs to be displayed. • Set PowerPad unit Clock: Programs the computer's time and date into the configuration of the PowerPad unit.
Chapter 4 DATAVIEW Software Alarm Conditions Configuration The Alarm Conditions window lets you set up 10 alarm configurations. Figure 6 - Alarm Conditions Window • Hysteresis: This value for alarms is set to prevent multiple recordings of an event that goes above the threshold and a certain percentage below it at times. EXAMPLE Alarm threshold is 100V or higher, hysteresis is 1%. When the voltage goes up to 100V, the alarm condition starts.
DATAVIEW Software Chapter 4 – Athd: current total harmonic distortion – W: active power – Acf: current crest factor • Duration: The Alarm will only be recorded if the duration of the parameter meeting the threshold criteria exceeds the duration. The minimum alarm duration can be in minutes or seconds. In the case of Vrms, Urms, or Arms not using neutral current, can also be in hundredths of a second. • Disable All Alarms: This check box prevents any alarms from being captured.
Chapter 4 DATAVIEW Software For each selected harmonic data type, you can choose a range of harmonics to record from the 1st to 50th. You can further limit that range to only include odd numbers by checking the box for Odd Harmonics Only. • End Recording: Ends any recording in progress or any future recording. • Clear Entries: Clears the data entered in the new recording window. It does not cause any changes to the PowerPad unit.
DATAVIEW Software Chapter 4 Transients Configuration The Transients window allows you to set up the criteria for capturing transients. Figure 8 - Transients Window 1. Type a name for the session, up to seven characters. 2. Select the date and time to end the search for transients. 3. Select the percent deviation for voltage and current transients. The choices available from the drop down window are 1, 2, 5, 10, 20, 50, and 100% of the full scale range of measurement.
Chapter 4 DATAVIEW Software The purpose of the EN50160 standard Voltage characteristics of electricity supplied by public distribution systems is to specify the characteristics of the supply voltage with regard to the course of the curve, the voltage level, the frequency, and symmetry of the 3-phase network at the interconnecting point to the customer. The goal is to determine limiting values for regular operating conditions.
DATAVIEW Software Real-time Windows Chapter 4 When your setup is completed, you can display different views on the screen of real time data and waveforms. Waveform, Harmonic Bar and Harmonic Text Figure 10 - Real-time Data On each screen, you can: • Select the type of data to see • Stop the update with the Hold function • Print the screen selected • Save it to disk. Download Data to Database From the Instrument menu, select data to download the data recorded to the PowerPad unit. 1.
Chapter 4 DATAVIEW Software Photographs The Photographs window displays a list of photographs taken on the PowerPad unit. It shows the date and time when the camera button was pressed. When Download to Database is selected, it shows the waveforms, power data, and Bitmap image of the PowerPad unit screen from the time the camera button was pressed. TIP 64 Snapshots can only be initiated by using the Camera button PowerPad unit itself, not by DATAVIEW.
DATAVIEW Software Chapter 4 Alarms The Alarms window displays a list of alarms recorded on the PowerPad unit. A subset of the list, can be viewed by the phase of the triggering event. Alarms can be selected and downloaded to a database. The downloaded alarms contain no more information than is shown in the screen display.
Chapter 4 DATAVIEW Software Transients The Transients window displays transients stored on the PowerPad unit. It shows the number and name of the recording, and the time it began and ended. The selected transients can either be downloaded or deleted. The downloaded result contains four waveforms.
DATAVIEW Software Chapter 4 Power/Energy The Power/Energy window displays accumulated power and energy data. Accumulated energy data can be started or stopped, and the results can be download to a database, and viewed on the screen, selected by phase. The data for all available phases are downloaded to a database, not just that TIP shown on the screen. EN50160 The EN50160 window displays recorded tests that can be downloaded and analyzed.
Chapter 4 DATAVIEW Software Session Properties After downloading the data that is selected, the Session Properties window opens, which consists of the following: • Operator Information: Information associated with the person and company conducting the test. • Site Information: Information about the site itself. • Comments: A place where information can be typed, such as, further descriptive analysis of the test, the test results, or reasons for running the test.
Chapter 5 Maintenance Use only factory specified replacement parts. Rockwell Automation is not held responsible for any accident, incident, or malfunction following a repair done other than by its service center or by an approved repair center. Recharging and Changing the Battery The battery is automatically charged when the unit is connected to AC power.
Chapter 5 Maintenance Notes: 70 Rockwell Automation Publication 1412-UM001D-EN-P - September 2012
Appendix A Catalog Number Explanation Available PowerPad Units and Accessories Table 2 - Catalogs Cat. No. Description 1412-PP2127 PowerPad portable power monitor Table 3 - Probe selection (one selection is required) Cat. No.
Appendix A Catalog Number Explanation Notes: 72 Rockwell Automation Publication 1412-UM001D-EN-P - September 2012
Appendix B Specifications Reference Conditions Attribute Reference Conditions Ambient temperature 23 °C ± 3 °C (73 °F ± 5 °F) Humidity 45% Atmospheric pressure 25.4" Hg … 31.3" Hg (860 … 1060 hPa) Phase voltage 230V rms and 110V rms ±2% without dc Clamp current circuit input voltage 0.03V to 1V rms without DC (< 0.5%) AMPFLEX current circuit input voltage 11.8mV … 118mVrms without DC (< 0.5%) Frequency of electricity network 50 and 60 Hz ± 0.
Appendix B Specifications Voltage Inputs Attribute 1412-PP2127 Operating Range Phase-phase - 960V rms ac/DC Phase-neutral - 480V rms ac/dc Input Impedance 340 k between phase and neutral Overload 1.2Vn permanently; 2Vn for 1 sec (Vn = nominal voltage) Current Inputs Attribute 1412-PP2127 Operating Range 0…1V Input Impedance 100 k for current probe circuit and 12.4 k for AMPFLEX circuit Overload 1.
Specifications Appendix B Table 4 - Accuracy Specifications 1412-PP2127 Function Range Display Resolution Accuracy Apparent Power (VA) 0VA … 9999 kVA 4 digits ±1 % ± 1 ct Power Factor (PF, DPF) -1.000 … 1.000 Cos 0.5 Cos 0.2 … < 0.5 0.001 Tangent (Tan) for VA 50VA -32.76 … 32.76 0.001 Tan < 10 0.01 Tan < 10 Active Energy (Wh) Clamp-on and AMPFLEX Clamp-on AMPFLEX 0 Wh … 9999 MWh Cos 0.8 Cos 0.2 … < 0.8 Cos 0.5 … < 0.
Appendix B Specifications Nominal Range of Use Attribute 1412-PP2127 Frequency 40 … 69 Hz Harmonics THD (I) - 0 … 40% THD (U) - 0 … 20% Magnetic Field < 40.
Specifications Attribute 1412-PP2127 Dimensions 240 x 180 x 55 mm (9.5 x 7.0 x 2.0 in.) Weight 2.1 kg (4.
Appendix B Specifications Safety Specifications Attribute 1412-PP2127 Electrical Safety (per EN 61010-1) Double insulation 600V rms, Category IV, Pollution Degree 2 Electromagnetic Compatibility Immunity and Emission EN 61236-1 amendment 1 Electrostatic Discharges IEC 1000-4-2 Radiation Field Resistance IEC 1000-4-3 Fast Transients Resistance IEC 1000-4-4 Electric Shock Resistance IEC 1000-4-5 Conducted RF Interference IEC 1000-4-6 Mechanical Protection 1200 Amp AC Current Probe (Base Un
Specifications Appendix B Table 5 - Factors Affecting Accuracy (% of the output signal)(1) Conditions Range Error Temperature -10…50 °C (14 …122 °F) 200 ppm/°C or 0.2% per 10 °C Relative humidity 10…90% < 0.1% Frequency 30…48 Hz 65…1000 Hz 1…5 kHz < 0.5% < 1% < 2% Position of the cable in the jaws - < 0.1% at 400 Hz Adjacent conductor carrying a 60 Hz AC current Conductor in contact with the sensor 0.
Appendix B Specifications Table 6 - Factors Affecting Accuracy (% of the Output Signal)(1) Conditions Range Error Temperature -10… 50 °C (14… 122 °F) 150 ppm/K or 0.15% per 10K Relative humidity 10 … 90% < 0.2% Frequency response 40 Hz … 10 kHz 40 Hz … 1 kHz: < 3% 1 … 10 kHz: < 12 % Position of the cable in the jaws - < 0.
Specifications Appendix B Table 8 - Factors Affecting Accuracy (% of the Output Signal) 6/120 Amp AC Current Probe (Base Unit Accuracy Included) Conditions Range Error Temperature -20…60 °C (-4…140 °F) 0.2% per 10 °C Relative humidity 10 … 90% RH 0.5% Frequency response 10 Hz…20 kHz 0.
Appendix B Specifications Table 9 - Accuracy Specifications - Range 10 mV/A (1 V at 100 A rms)(1) Primary current (in A ac) 0.1 … 1 A 1 … 120 A Accuracy (% of the output signal) 1% ± 2 ct 1% ± 1 ct Phase shift (°) 1.5° 1° (1) Overload: 120 A continuous. Primary current (in A ac) Probe Output 1…10 A 5…50 mA 10…100 A 0.05…0.5 A 100…1200 A 0.5…6 A Accuracy (% of the output signal) 1.5% ± 1 ct 1.5% ± 1 ct 1% ± 1 ct Phase shift (°) 1.
Specifications 1000 Amp AC and 1400 Amp DC Current Probe (Base Unit Accuracy Included) Appendix B Attribute 1412-PP2137-05 Nominal Range 1000 A AC 1400 A DC max Measurement Range 10…1000 A AC max, 10…1300 A peak AC + DC(1) Probe Output Signal 1 mV/A Maximum Cable Diameter One 42 mm (1.6 in.) or two 25.4 mm (0.98 in.) or two bus bars 50 x 5 mm (1.96 x 0.19 in.
Appendix B Specifications Table 11 - Factors Affecting Accuracy (% of the Output Signal) Conditions Range Error Rejection in common mode (ac) 50…400 Hz > 65 dB Remanence in DC +1300 A DC at -1300 A DC < 4 mA/A Frequency of the measurement signal 65…440 Hz 440 Hz…1 kHz 1 kHz…10 kHz -2% -5% -4dB (1) Battery: 9V alkaline (NCDA 1604 A, 6LR61). (2) Battery Life: Approximately 120 hr with alkaline.
Appendix C Mathematical Formulas For Various Parameters Half-period Voltage and Current RMS Values Vdem [] i = Udem[] i = Adem[] i = 2 NSHC ⋅ 2 NSHC ⋅ 2 NSHC ⋅ Next Zero i n] ∑V [][ 2 Single rms voltage half-period i + 1 phase n:Zero Next Zero i n] ∑U[][ 2 Compound rms voltage half-period i + 1 phase n:Zero Next Zero i n] ∑A [][ 2 Rms current half-period i + 1 phase n:Zero • NSHC: number of samples per half cycle (between two consecutive zeros) • n: sample (0; 255) • i: phase (0;
Appendix C Mathematical Formulas For Various Parameters Peak Factors for Current and Voltage Vcf [] i = Ucf [] i = i = Acf [] One Second RMS Values for Voltage and Current Vrms [] i = Urms [] i = Arms [] i = max(Vpp[] i ,Vpm [] i) 1 NSC ⋅ NSC − 1 i n] ∑V [][ Peak factor single voltage i + 1 phase 2 n =0 max(Upp[] i ,Upm[] i) 1 NSC ⋅ NSC − 1 i n] ∑U[][ Peak factor phase-phase voltage i + 1 phase 2 n =0 max(App[] i ,Apm[] i) 1 NSC ⋅ NSC − 1 i n] ∑A [][ Peak factor current i + 1 phase
Mathematical Formulas For Various Parameters THD Calculation 50 ∑Vharm [i][n] Vthd[i] = n=2 Vharm [i][1] 50 ∑Uharm [i][n] 2 , Uthd[i] = n=2 Uharm [i][1] Appendix C 50 ∑Aharm [i][n] 2 , 2 n=2 Athd[i] = Aharm [i][1] • i: phase (0, 1, 2) • n: range (2 to 50) Calculation of Harmonic Bins Harmonic bins are calculated by FFT with 16 bit resolution (1024 samples on 4 cycles) without windowing (IEC 1000-4-7).
Appendix C Mathematical Formulas For Various Parameters Distortion Factor Calculation (DF) Two global values giving the relative quantity of harmonics are computed: the THD in proportion to the fundamental and the DF in proportion to the RMS value.
Mathematical Formulas For Various Parameters Ratios PF[i] = W[i] VA[i] Appendix C i + 1 phase power factor DPF[i] = cos(φ[i]) i + 1 phase displacement factor Tan[i] = tan(φ[i]) i + 1 phase tangent NSS-1 i n] .
Appendix C Mathematical Formulas For Various Parameters Wh[1][i] = ∑ W[i] 3600 Active energy consumed phase i + 1 VAh[1][i] =∑ VA[i] 3600 Active energy consumed phase i + 1 Tint Tint –VAR[i] for VAR[i] ≤0 Reactive inductive energy consumed phase i + 1 Tint 3600 VARhL[1][i] = ∑ VARhC[1][i] = ∑ Tint VAR[i] for VAR[i] ≥0 Reactive capacitive energy consumed phase i + 1 3600 Total active energy consumed: Wh[1][3] = Wh[1][0] + Wh[1][1] + Wh[1][2] Total apparent energy consumed: VAh[1][3] = VAh[1][0]
Mathematical Formulas For Various Parameters Appendix C Sag of Interruption Detection Duration Hysteresis = 2% Uref Level to go back = (100% + 2%)Uref Threshold = 102% Uref Rockwell Automation Publication 1412-UM001D-EN-P - September 2012 91
Appendix C Mathematical Formulas For Various Parameters Notes: 92 Rockwell Automation Publication 1412-UM001D-EN-P - September 2012
Glossary These are terms and symbols used throughout the manual.
Glossary Symbol Definition L2 Phase two of voltage (phase-to-neutral) plus current L3 Phase three of voltage (phase-to-neutral) plus current Up/Down buttons Enter button Parameter Selected for Recording Parameter Not Selected for Recording Left/Right Selection buttons Right Selection button Left Selection button Warning Double or Reinforced Insulation Danger - Risk of Electric Shock Transients Mode Harmonics Mode Harmonic Analysis Waveforms Mode Power/Energy Mode Recording Mode Alarm Mode 94 Rockwel
Glossary Symbol Definition Set Up Mode Snapshot Capture Direct Print Help Tabular Display Of Measurements Phasor diagram Display Battery Charging or Discharging 25% 100% Battery Full Battery Empty Discharging 0% New Battery Discharging ? Power On / Off Validate the Setting W... Power Parameters PF...
Glossary Symbol Definition Starts Capture or Recording Search Displays a captured transient Deletes a captured transient Returns to the transient selection screen Zoom In Zoom Out Saving Opening a Saved Display 96 Rockwell Automation Publication 1412-UM001D-EN-P - September 2012
Index A accuracy specifications 74 alarm 23 programming 24 alarm conditions configuration 58 alarm mode 41 alarms 65 B battery status 13 baud rate 20 C calculation parameters 17 changing the battery 69 cleaning 69 clear memory 24 colors 17 computer requirements 52 configuration 15 alarm 23 alarm conditions 58 baud rate 20 calculation parameters 17 clear memory 24 colors 17 contrast and brightness 17 current sensors 19 date and time 16 display 57 electrical hookup 18 EN50160 61 line frequency 25 record 59
Index harmonics mode 32 harmonic analysis in expert mode 34 power and direction flow analysis 33 single phase and phase to phase current analysis 33 single phase and phase to phase voltage analysis 32 help 49 L line frequency 25 M maintenance 69 mechanical specifications 77 minimum and maximum current value measurements 30 minimum computer requirements 52 modes 27 waveform 27 N nominal range of use 76 O open previously saved snapshot 48 opening previously stored transients 39 operation 15 P pf button
Index total harmonic distortion measurement on one phase 29 transient mode 37 opening previously stored 39 storing the trigger 39 transients 66 transients configuration 61 V voltage inputs 74 W waveform 27 waveform mode 27 minimum and maximum current value measurements 30 phasor diagram display 31 rms current measurement on 3 phases and neutral current on a three phase 4 wire system 29 rms voltage measurement on 3 phases 28 simultaneous display of different current measurements 30 total harmonic distorti
Index 100 Rockwell Automation Publication 1412-UM001D-EN-P - September 2012
Rockwell Automation Support Rockwell Automation provides technical information on the Web to assist you in using its products. At http://www.rockwellautomation.com/support, you can find technical manuals, technical and application notes, sample code and links to software service packs, and a MySupport feature that you can customize to make the best use of these tools. You can also visit our Knowledgebase at http://www.rockwellautomation.