User Manual PowerMonitor 1000 Unit Catalog Numbers 1408-TR1A-485, 1408-TR2A-485, 1408-EM1A-485, 1408-EM2A-485, 1408-EM3A-485, 1408-TR1A-ENT, 1408-TR2A-ENT, 1408-EM1A-ENT, 1408-EM2A-ENT, 1408-EM3A-ENT
Important User Information Read this document and the documents listed in the additional resources section about installation, configuration, and operation of this equipment before you install, configure, operate, or maintain this product. Users are required to familiarize themselves with installation and wiring instructions in addition to requirements of all applicable codes, laws, and standards.
Summary of Changes This manual contains new and updated information. Changes throughout this revision are marked by change bars, as shown to the right of this paragraph. New and Updated Information This table contains the changes made to this revision.
Summary of Changes Notes: 4 Rockwell Automation Publication 1408-UM001D-EN-P - September 2013
Table of Contents Important User Information . . . . . . . . . . . . . . . . . . . . . . . . . . . . . . . . . . . . . . . . 2 New and Updated Information. . . . . . . . . . . . . . . . . . . . . . . . . . . . . . . . . . . . . . 3 Summary of Changes Table of Contents Preface Before You Begin. . . . . . . . . . . . . . . . . . . . . . . . . . . . . . . . . . . . . . . . . . . . . . . . . . . 7 Catalog Number Explanation . . . . . . . . . . . . . . . . . . . . . . . . . . . . . . . . . . . . . . .
Table of Contents Communications Command Summary Explicit Messaging Chapter 4 Serial DF1 Full-duplex, DF1 Half-duplex Slave, DH485 . . . . . . . . . . . . 51 Optional EtherNet/IP . . . . . . . . . . . . . . . . . . . . . . . . . . . . . . . . . . . . . . . . . . . . 51 Modbus RTU Serial and Optional Modbus/TCP Ethernet . . . . . . . . . . 52 Chapter 5 Explicit Message Setup – Examples. . . . . . . . . . . . . . . . . . . . . . . . . . . . . . . . . 53 Reading Logs. . . . . . . . . . . . . . . . . . . .
Preface Before You Begin Use this document as a guide to set up communication with the Bulletin 1408 PowerMonitor 1000 unit using other applications and controllers. This document is intended for advanced users. You should already be familiar with data communication and programmable controller messaging.
Preface Additional Resources These documents contain additional information concerning related Rockwell Automation products. Resource Description PowerMonitor 1000 Unit Installation Instructions, publication 1408-IN001 This publication gives product description and functionality. Industrial Automation Wiring and Grounding Guidelines, publication 1770-4.1 Provides general guidelines for installing a Rockwell Automation industrial system. Product Certifications website, http://www.ab.
Chapter 1 PowerMonitor 1000 Overview Safety Follow these advisories when using this product. ATTENTION: Only qualified personnel, following accepted safety procedures, should install, wire, and service the power monitor and its associated components. Before beginning any work, disconnect all sources of power and verify that they are deenergized and locked out. Failure to follow these instructions may result in personal injury or death, property damage or economic loss.
Chapter 1 PowerMonitor 1000 Overview About the PowerMonitor 1000 Unit The power monitor is a compact, cost-effective, electric power and energy metering device intended for use in industrial control applications, such as destribution centers, industrial control panels, and motor control centers. It measures voltage and current in an electrical circuit, meeting revenue accuracy standards.
Chapter 1 PowerMonitor 1000 Overview Hardware Features 1 3 2 EtherNet/IP RS-485 4 RS-485 RX ACT 7 LNK 5 TX STATIS Mod 6 PowerMonitor 1000 Net + - SHLD 8 9 10 11 12 13 Feature Description 1. Ethernet network port standard RJ-45 jack with status indicators Ethernet network port hardware is included on all models. The port functions only on units ordered with or upgraded to the Ethernet network. The following protocols and functions are supported.
Chapter 1 PowerMonitor 1000 Overview Feature Description 7. Voltagesensing wiring terminals • Direct connect up to 600V AC three-phase line-to-line • Maximum nominal line-to-ground voltage 347V • Use potential transformers (PTs) for higher voltages 8. Currentsensing wiring terminals • Nominal input current 5 A • Use current transformers (CTs) to connect to power system 9. DIN-rail clips • Top and bottom clips for mounting unit on DIN rail 10.
Chapter 1 PowerMonitor 1000 Overview Measured Parameters TR1 TR2 Min / max log • • EM1 Status log • • EM3 • • • • • • • • • Load factor log Time of use logs EM2 Troubleshooting mode lets you enter a password-protected command that promotes your PowerMonitor unit to an EM3 model. This makes all measured parameters available for troubleshooting purposes. Communication Overview All PowerMonitor 1000 units come standard with an RS-485 serial communication port.
Chapter 1 PowerMonitor 1000 Overview TIP When configuring serial communication, users should verify that all serial devices wishing to communicate to the power monitor have the same communication rate, and the same data format. DH485 Protocol DH485 is a token-passing protocol that allows messaging by up to 32 nodes on a serial network. The master is the node that owns the token; only the master may transmit messages. When a node has completed transmitting messages, it passes the token to the next node.
PowerMonitor 1000 Overview Chapter 1 EtherNet/IP Protocol The power monitor supports the EtherNet/IP protocol for communicating via Ethernet or EtherNet/IP drivers in RSLinx Classic software, or when using explicit messages from Rockwell Automation controllers communicating via Ethernet or EtherNet/IP network. Modbus TCP Protocol Modbus TCP protocol is also supported for communicating via Modbus TCP for communication.
Chapter 1 PowerMonitor 1000 Overview Use the LCD Screen The power monitor has an onboard LCD for viewing and configuration. Buttons are provided to control the display. The display has three modes of operation. • Display mode lets you select and view parameters including metering, event log, and self-test information. • Program mode lets you change configuration parameters, with security against unauthorized configuration changes. Each power monitor is password protected.
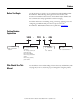
PowerMonitor 1000 Overview Chapter 1 This diagram shows how to navigate in the display and configuration menu.
Chapter 1 PowerMonitor 1000 Overview Default Screen The power monitor lets you select and navigate to a default screen. The default screen displays at startup and is displayed after the display has been dormant for approximately 30 minutes. To set the current screen as the default, press Enter and click Yes. If you’re in another menu and want to get back to the default screen, continue pressing Escape until you are prompted To Default Screen? Click Yes to display the default screen.
PowerMonitor 1000 Overview Chapter 1 Edit a Parameter To edit a parameter, do the following: • Press or to change the highlighted digit. • Press and together to move the highlight cursor one place to the left, and press or to set the selected digit’s value. Continue in the same way until the correct value is entered then press when done.
Chapter 1 PowerMonitor 1000 Overview 3. Press or once. Program appears in the display. Press . RS-485 RX TX STATUS PowerMonitor 1000 Mod Net Password 0000 4. Press if the password has not been changed from the default (0000). If the password has been changed, then enter the correct password. RS-485 RX TX STATUS PowerMonitor 1000 Mod Net Program Setup When the correct password is entered, Program Setup appears in the display.
PowerMonitor 1000 Overview Chapter 1 6. With Advanced Setup displayed, press , then press until Set Date Year appears. RS-485 RX TX STATUS PowerMonitor 1000 Mod Net Set Date Year 2008 7. Press to change the value of the year. The power monitor is now in Edit mode, indicated by the presence of the highlight cursor. Change the year value and press to save it or to discard changes. See Edit a Parameter on page 19 if you need help with this.
Chapter 1 PowerMonitor 1000 Overview View Data with the Display You may also view power monitor wiring diagnostics, metering, status and setup data using the display. To view data, select Display (instead of Setup) from the top menu and navigate through the menus as in the setup example. Press and to navigate into and out of submenus and and to select items within a submenu. Display mode does not permit you to change any parameter.
PowerMonitor 1000 Overview Chapter 1 2. Click Configure Options to access the setup menus. EXAMPLE You can change the IP address of the power monitor by navigating to the Ethernet Communication screen. Enter the password, change the IP address, and save it by clicking Submit. Now you can type in the new IP address in your browser and the main page refreshes using the new address. 3. Every time you change a setting or configuration you need to enter the power monitor’s password (default = 0).
Chapter 1 PowerMonitor 1000 Overview Use Communication to Set Up Please refer to the PowerMonitor 1000 User Manual, publication 1408-UM001, for detailed information on configuring the unit through communication with a programmable controller or custom software application. Set-up Menus Whichever set-up method you select, set-up parameters are organized in five setup menus.
Chapter 2 PowerMonitor 1000 Unit Features This section describes in detail the functions of the power monitor. Each function includes information on set-up menus and parameters used to control its operation. Analog Input Setup This feature applies to all models. Setup The power monitor calculates metering results based on scaled voltage and current inputs. Setting up the analog inputs is necessary to obtain accurate, properly scaled metering results.
Chapter 2 PowerMonitor 1000 Unit Features Wiring Diagnostics The power monitor performs wiring diagnostics on command to detect and report wiring errors. Wiring diagnostics operate in any wiring mode except Demo and 1PT 1CT modes, provided that measured current is at least 10% of the CT primary parameter in Analog Setup. You may select from three ranges of system power factor to improve wiring diagnostics accuracy. This function applies to all models.
PowerMonitor 1000 Unit Features Chapter 2 • Current rotation, referenced to voltage Phase 1 – -1 — Test not run; see wiring status for reason. – 123 — Forward rotation (ABC). – 231 — Forward rotation, 120 degrees displaced (BCA). – 312 — Forward rotation, 240 degrees displaced (CAB). – 132 — Reverse rotation (ACB). – 213 — Reverse rotation, 120 degrees displaced (BAC). – 321 — Reverse rotation, 240 degrees displaced (CBA). – 4 — Invalid phase rotation (2 inputs wired with same phase).
Chapter 2 PowerMonitor 1000 Unit Features Results Wiring diagnostics results may be viewed using the following methods: • Web interface • LCD screen • Communication • HyperTerminal communication tool Commands • Perform wiring diagnostics • Test wiring connections (LCD screen menu) Troubleshooting Mode Troubleshooting mode lets you enter a password-protected command that makes available all metered parameters for troubleshooting purposes. Troubleshooting mode does not change the data log support.
PowerMonitor 1000 Unit Features RS-485 Communication Chapter 2 This function applies to all models. Setup Your power monitor is set up to communicate via its RS-485 port using a default set of parameters when you first apply power.
Chapter 2 PowerMonitor 1000 Unit Features Optional Ethernet Network Communication The power monitor supports simultaneous operation of the optional Ethernet network and serial ports. This feature applies to all models with catalog numbers ending in -ENT. The Ethernet network port supports 10 or 100 Mbps data rate, half-duplex, or full-duplex. Setup The Ethernet network port is set up with a default IP address and gateway using a common auto-configuration addressing scheme.
PowerMonitor 1000 Unit Features Chapter 2 Ethernet Network Addressing The IP address is a 32-bit binary number, which consists of the network address (NetID) and the machine address (HostID). The Subnet mask defines the boundary between the NetID and HostID and each 0 represents the HostID.
Chapter 2 PowerMonitor 1000 Unit Features Energy results (kWh, kVARh, and kVAh) roll over to 0 at a value of 9,999,999,999,999 or 1012-1. Setup Only basic analog input setup is required for energy metering. Results Energy metering results may be viewed using the following methods: • Web interface • LCD screen • Communication Energy results are not available via the HyperTerminal communication tool.
Chapter 2 PowerMonitor 1000 Unit Features Metered Parameters The power monitor calculates and returns the following demand values: • Real power demand, kW • Reactive power demand, kVAR • Apparent power demand, kVA • Demand power factor, percent lagging (-) or leading (+) • Projected kW, kVAR, and kVA demand • Demand interval elapsed time, minutes Projected demand calculates a linear projection of demand at the end of a demand interval. Demand power factor is calculated using the following formula.
Chapter 2 PowerMonitor 1000 Unit Features Parameter Description Range Default Forced Demand Sync Delay (advanced setup) If demand source 0 and demand period length 0 then this parameter determines how long the unit waits for an EOI pulse, command, or broadcast after the expected control pulse has not been received. If the EOI signal is not received before the waiting period expires, a new demand period starts and a record is entered in the status log.
PowerMonitor 1000 Unit Features Chapter 2 Metered Parameters The power monitor calculates and returns four-quadrant power measurements including these: • L1, L2, L3 and Total True Power Factor, percent lagging (-) and leading (+) • L1, L2, L3 and Total Real Power, kW • L1, L2, L3 and Total Reactive Power, kVAR • L1, L2, L3 and Total Apparent Power, kVA Only total three-phase power results are provided when Direct Delta or Open Delta wiring modes are selected.
Chapter 2 PowerMonitor 1000 Unit Features Results Power metering results may be viewed using the following methods: • Web interface • LCD screen • Communication • HyperTerminal communication tool Related Functions • Metering result averaging • Configuration lock Voltage, Current, and Frequency Metering This function applies to catalog numbers 1408-TR1, 1408-TR2, and 1408-EM3.
PowerMonitor 1000 Unit Features Chapter 2 Results Voltage, current, and frequency metering results may be viewed using the following methods: • Web interface • LCD screen • Communication • HyperTerminal communication tool Related Functions • Metering result averaging • Configuration lock Date and Time Functions The power monitor internal clock and calendar is used in demand metering and data logging functions.
Chapter 2 PowerMonitor 1000 Unit Features Daylight-savings Time Setup Daylight-savings time (DST) setup is done in the Advanced Setup menu. If DST is enabled, the power monitor internal clock advances by one hour on the start date and hour specified, and is set back by one hour on the return date and hour specified. The defaults represent the common DST start and return date/times in use in the United States in 2006. The DST function also adjusts the networktime synch offset when used.
PowerMonitor 1000 Unit Features Chapter 2 Related Functions • Demand metering • Data logging Energy Log The energy log is one of five data logs where the power monitor records metering and status data. Data logging setup is performed using optional RSPower or RSEnergyMetrix RT software via communication. Refer to RSPower Getting Results Guide, publication RSPWR-GR002 and RSEnergyMetrix Getting results guide, publication ENEMTX-GR001 for information on the software.
Chapter 2 PowerMonitor 1000 Unit Features Commands • Clear energy log Related Functions • Energy metering, Demand metering • Configuration lock Min/Max Log The power monitor records time-stamped minimum and maximum values for all real-time metering data (except for energy data). This feature applies to catalog numbers 1408-TR1, 1408-TR2, and 1408-EM3.
PowerMonitor 1000 Unit Features Chapter 2 Commands • Clear single min/max log record • Clear min/max log Related Functions • • • • Load Factor Log Energy metering Demand metering Voltage, current and frequency metering Power metering The power monitor maintains a 12-month record of demand and load factor. Load factor is average demand divided by peak demand and is a measure of load variability. This function applies to catalog numbers 1408-EM2 and 1408-EM3.
Chapter 2 PowerMonitor 1000 Unit Features Related Functions • Demand metering Time of Use Logs The power monitor maintains records of energy and demand organized by times of use you define. These records may be used for billing and cost allocation by RSPowerPlus software. There are up to three time-of-use (TOU) logs, one for real energy and demand, one for reactive energy and demand, and one for apparent energy and demand.
PowerMonitor 1000 Unit Features Status Log Chapter 2 The Status log records the date and time of changes made to the device and of external events. The status log consists of 50 records and operates in a circular or FIFO fashion. The status log may not be cleared. This function applies to all models.
Chapter 2 PowerMonitor 1000 Unit Features Operation The KYZ output can operate in any of the following modes: • Energy pulse operation with fixed pulse width or toggle • Forced operation Setup KYZ-output set-up parameters are found in the Advanced Setup menu and are summarized in the table.
Chapter 2 PowerMonitor 1000 Unit Features Operation Each time status input 1 sees an off-to-on transition, the status input 1 scale factor is added to the status input 1 count. The count continues to increase, rolling over to zero at a value of 9,999,999,999,999 (1012 – 1). Status input 2 operates in the same fashion. Status input 2 counter operates whether or not the input is used for demand EOI synchronization.
Chapter 2 PowerMonitor 1000 Unit Features Configuration Lock Input Unauthorized changes to the power monitor setup are prevented when the configuration-lock input terminals, CF and CF1, are connected together. This feature applies to all models.
Chapter 2 PowerMonitor 1000 Unit Features Miscellaneous Functions The power monitor includes a small number of miscellaneous functions that you can select. Set-up parameters of these functions are in the Advanced Configuration set-up menu. Parameter Description Range Default New Password Select a new password if desired to help prevent unauthorized changes to the unit setup.
Chapter 2 PowerMonitor 1000 Unit Features Command Parameters Action Reset system - Warm reboot: Performs a power-on self test of the power monitor Test wiring connections - Perform wiring diagnostics Clear min/max records Min/max record number Clears selected min/max record or all records if parameter = 0 Store and clear current load factor record - Simulates end-of-month push of in-process current month into the monthly load factor record stack Clear load factor log Clears all load factor
Chapter 3 PowerMonitor 1000 Memory Organization The power monitor memory is organized similarly to that of a PLC-5 or SLC 500 programmable controller. Data tables organize individual data items of similar function. For example, the analog input set-up parameters are grouped in one data table, and voltage, current, and frequency metering results in another. Appendix A provides a detailed list of the power monitor data tables. Data Table Addressing Data tables may be addressed in several ways.
Chapter 3 PowerMonitor 1000 Memory Organization Data Table Access Controllers and client applications may read or write single element, multiple elements or complete tables as permitted by the addressing selected. Each data table’s read/write access is listed in Appendix A. The power monitor requires a valid password before it accepts a write. There are two ways a password may be written. • An entire table including a valid password may be written.
Chapter 4 Communications Command Summary Serial DF1 Full-duplex, DF1 Half-duplex Slave, DH485 • PCCC Protected Logical Read w/ 2 Address Fields (CMD = 0x0F, FUNC = 0xA1) • PCCC Protected Logical Write w/ 2 Address Fields (CMD = 0x0F, FUNC = 0xA9) • PCCC Protected Logical Read w/ 3 Address Fields (CMD = 0x0F, FUNC = 0xA2) • PCCC Protected Logical Write w/ 3 Address Fields (CMD = 0x0F, FUNC = 0xAA) • PCCC Protected Logical Write w/ 4 Address Fields (CMD = 0x0F, FUNC = 0xAB) • PCCC Status Diagnostics (CMD
Chapter 4 Communications Command Summary Modbus RTU Serial and Optional Modbus/TCP Ethernet 52 The power monitor does not initiate Modbus commands but responds to commands sent by the Modbus master. These Modbus function codes are supported.
Chapter 5 Explicit Messaging This section discusses data retrieval and parameter configuration using explicit messaging from Rockwell Automation controllers. Explicit messaging allows you to read and write from a controller to specific data tables within the power monitor. With explicit messages, users can read real-time power and energy values, configure analog input parameters, configure communication parameters, and also read energy logs.
Chapter 5 Explicit Messaging Table 2 - Message Type Read/Write Type Communication Read/Write Message Type Single Element Serial SLC Typed Single Element Ethernet PLC5 Typed or SLC Typed Multiple Element Serial SLC Typed Multiple Element Ethernet PLC5 Typed or SLC Typed or CIP Generic(1) (1) The CIP Generic message type is only available for RSLogix5000 software. All elements in the data table are written to or read back.
Explicit Messaging Chapter 5 Follow these steps to configure a message. 1. Choose the appropriate parameters in the Message Configuration window. Parameter Choice Message type Select the appropriate message type according to Message Type on page 54. Source Element Read: Refer to Appendix A – PowerMonitor 1000 Data Tables for the address of the specific data table address you’re reading.
Chapter 5 Explicit Messaging 3. Choose the communication type and then set the path and communication method. Communication Type Path Method Ethernet CIP Serial communication CIP 4. Click OK to complete the message setup.
Explicit Messaging Chapter 5 Follow these steps to configure a message. 1. Choose the appropriate parameters in the Message Configuration window. Parameter Choice Message Type Choose message type CIP Generic. Service Type Read: Select service type Get Attribute Single Write: Select service type Set Attribute Single Instance Refer to Appendix A for the CIP Instance of the data table you are requesting to read.
Chapter 5 Explicit Messaging 2. Click the Communication tab and enter the path and method. Path Method CIP 3. Click OK to complete message setup.
Explicit Messaging Chapter 5 RSLogix500 Software - Message Setup Using PLC5 or SLC Typed Read/Write The following is an example of how to set up your message instruction to read or write single or multiple elements to a power monitor using Peer-To-Peer PLC5 or CPU 500 Typed messages in RSLogix500 software. This setup applies to SLC and MicroLogix programmable logic controllers. Follow these steps to configure a message. 1. Set your MSG instruction.
Chapter 5 Explicit Messaging 3. Choose the appropriate parameters in the Message Configuration window. Ethernet Network Communication Serial Communication Communication Type Parameter Choice Ethernet Data Table Address (This Controller) Read: This is the controller tag in which to store the data being read Write: This is the controller tag that stores the value to be written to the power monitor. 60 Size in Elements This is the number of elements being read or written to.
Explicit Messaging Chapter 5 Communication Type Parameter Choice Serial Data Table Address (This Controller) Read: This is the controller tag in which to store the data being read Write: This is the controller tag that stores the value to be written to the power monitor. Size in Elements This is the number of elements being read or written to. If you are performing a single element read or write, then this value should be 1.
Chapter 5 Explicit Messaging Follow these steps to configure a message. 1. Choose an available message data block in your message instruction. In this example, we used MG9:0. 2. Click Setup Screen at the bottom of the message instruction. The message configuration window for either Ethernet network or Serial communcation appears. 3. Choose the appropriate parameters in the Message Configuration window.
Explicit Messaging Chapter 5 Communication Type Parameter Choice Ethernet Communication Command Select the appropriate message type according to Message Type on page 54. Data Table Address (This Controller) Read: This is the controller tag in which to store the data being read. Write: This is the controller tag that stores the value to be written to the power monitor. Serial Size in Elements This is the number of elements being read or written to.
Chapter 5 Explicit Messaging 5. Enter the IP Address of the power monitor in the first row of the To Address column. Message setup is complete. Reading Logs You can perform explicit messages to read data from log records in the power monitor. For information on setting up explicit messages to the power monitor, please refer to Explicit Message Setup – Examples on page 53. The following logs can be read into a controller depending on the logs supported by your power monitor.
Explicit Messaging Chapter 5 Log Data Table Methodology The log data tables only hold one record instance for a specific log. Successive reads of the data table return a successive record instance for that log. By writing to specific configuration elements in the Log Request Table data table, you can configure the log to return in a forward or reverse direction. You can also configure the log to return a specific record for all logs except the Unit Status Log, and Energy Log.
Chapter 5 Explicit Messaging Example 2: Read Min/Max Log for Average Current This example explains how to configure the Log Request Table to read the Min/ Max log for Average Current. Refer to Min/Max Parameter List on page 103 for the specific record to return. In this example, Average Current is record 4. 1. Create a write message to write the following values to the Log Request Table.
Appendix A PowerMonitor 1000 Data Tables Summary of Data Tables The Summary of PowerMonitor 1000 Data Tables for all Communication Protocols table summarizes all data tables available and their general attributes The rest of the tables detail each specific data table and its associated elements, such as Modbus address, default value, ranges, and description.
Appendix A PowerMonitor 1000 Data Tables EM1 Data Access CSP File No. Unit Run Status Results R 30901…30925 25 • • • Min/Max Log Results R F29 22 31001…31022 11 good • • Min/Max Parameter List Refer to Page EM3 No of Elements TR2 Name of Data Table EM2 Modbus Addressing Range N28 CIP Ass’y Inst.
PowerMonitor 1000 Data Tables Data Tables Appendix A Table 2 - User Configured Table Results Parameters CSP File No. F9 CIP Instance 1 Applies to EM3 only No. of Elements 16 No. of Words 32 Data Type Float Data Access Read Only Table 3 - User Configured Table Results Element No. Modbus Address Element Name Description 0 31601-2 User selected Parameter #1 1 31603-4 User selected Parameter #2 Parameters previously setup during a write to User-configured Table Setup table.
Appendix A PowerMonitor 1000 Data Tables Table 4 - Analog Input Configuration Parameters CSP File No. F10 CIP Instance 3 Applies to All models No. of Elements 7 No. of Words 14 Data Type Float Data Access Read/Write Table 5 - Analog Input Configuration Element No. Modbus Address Element Name Default Value Range Description 0 40001-2 Password 0 0…9999 When writing the complete table this parameter allows the input data to be accepted.
PowerMonitor 1000 Data Tables Appendix A Table 6 - Advanced Configuration Parameters CSP File No. F11 CIP Instance 4 No. of Elements 22 No. of Words 44 Data Type Float Data Access Read/Write Element No. Modbus Address Range Element Name Default Value Range TR1 TR2 EM1 EM2 EM3 Table 7 - Advanced Configuration Description 0 40101-2 Password 0 0…9999 • • • • • When writing the complete table this parameter allows the input data to be accepted.
Appendix A PowerMonitor 1000 Data Tables Element No. Modbus Address Range Element Name Default Value Range TR1 TR2 EM1 EM2 EM3 Table 7 - Advanced Configuration 7 40115-16 Return from Daylight Savings Month/Week/ Day 110101 November, 1st, Sunday 10101… 120507 • • • • • This is the day that the power monitor will subtract an hour from the time. This feature also looks at Ethernet SNTP offset and corrects for the return from Daylight Savings.
PowerMonitor 1000 Data Tables Appendix A Default Value Range EM3 Description 15 40131-32 Demand Period Length 15 min 0…99 • • Specifies the desired period for demand calculations. When set to 0 there are no projected demand calculations. If the internal timer is selected a setting of 0 turns the demand function off. 16 40133-34 Number of Demand Periods 1 1…15 • • Specifies the number of demand periods to average for demand measurement.
Appendix A PowerMonitor 1000 Data Tables Table 8 - Serial RS-485 Port Configuration Parameters CSP File No. N12 CIP Instance 5 Applies to All models No. of Elements 9 No. of Words 9 Data Type Integer Data Access Read/Write Table 9 - Serial RS-485 Port Configuration Element No. Modbus Address Element Name Default Value Range Description 0 40201 Password 0 0…9999 When writing the complete table this parameter allows the input data to be accepted.
PowerMonitor 1000 Data Tables Appendix A Table 10 - Ethernet Configuration Parameters CSP File No. N13 CIP Instance 6 No. of Elements 23 No. of Words 23 Data Type Integer Data Access Read/Write Element No. Modbus Address Element Name Default Value Range TR1 TR2 EM1 EM2 EM3 Table 11 - Ethernet Configuration Description 0 40301 Password 0 0…9999 • • • • • When writing the complete table this parameter allows the input data to be accepted.
Appendix A PowerMonitor 1000 Data Tables Element No. Modbus Address Element Name Default Value Range TR1 TR2 EM1 EM2 EM3 Table 11 - Ethernet Configuration 13 40314 SNTP Mode Select 0 0…2 • • • • • This mode selects the mode of the SNTP function or to disable the SNTP function. 0 = Disable 1 = Unicast - The SNTP address points to a unicast server. 2 = Anycast Mode - The SNTP address is a broadcast address of an anycast group.
PowerMonitor 1000 Data Tables Appendix A Table 12 - Time Zone Information Value Offset from GMT Time Zone Name Areas in Time Zone 0 GMT-12:00 Dateline Standard Time Eniwetok, Kwajalein 1 GMT-11:00 Samoa Standard Time Midway Island, Samoa 2 GMT-10:00 Hawaiian Standard Time Hawaii 3 GMT-09:00 Alaskan Standard Time Alaska 4 GMT-08:00 Pacific Standard Time Pacific Time (US & Canada,; Tijuana) 5 GMT-07:00 Mountain Standard Time Mountain Time (US & Canada) US Mountain Standard Time
Appendix A PowerMonitor 1000 Data Tables Table 12 - Time Zone Information Value Offset from GMT Time Zone Name Areas in Time Zone 16 GMT+03:00 Arab Standard Time Kuwait, Riyadh Arabic Standard Time Baghdad E. Africa Standard Time Nairobi Russian Standard Time Moscow, St.
PowerMonitor 1000 Data Tables Appendix A Table 13 - Date and Time Configuration Parameters CSP File No. N14 CIP Instance 7 Applies to All models No. of Elements 8 No. of Words 8 Data Type Integer Data Access Read/Write Table 14 - Date and Time Configuration Element No. Modbus Address Element Name Default Value Range Description 0 40401 Password 0 0…9999 When writing the complete table this parameter allows the input data to be accepted.
Appendix A PowerMonitor 1000 Data Tables Table 15 - Log Configuration Parameters CSP File No. N15 CIP Instance 8 No. of Elements 12 No. of Words 12 Data Type Integer Data Access Read/Write Element Name Default Value Range EM2 EM3 0 40501 Password 0 0… 9999 • • • When writing the complete table this parameter allows the input data to be accepted. When writing a single parameter the separate password table should be used. Returns -1 on a read.
PowerMonitor 1000 Data Tables Appendix A Element Name Default Value Range EM2 EM3 4 40505 Off Peak Days 65 0…127 • • • This bit map field selects the off peak days. OFF-PEAK days have only one rate for billing. Bit0= Sunday Bit1= Monday Bit2= Tuesday Bit3= Wednesday Bit4= Thursday Bit5= Friday Bit6= Saturday Saturday and Sunday are default Off Peak days. 5 40506 MID Peak AM Hours 1792 0… 4095 • • • This bit map selects any AM hours that are designated as MID Peak.
Appendix A PowerMonitor 1000 Data Tables Table 16 - Log Configuration 9 40510 Load Factor log Auto Log Setting 31 0…31 10 40511 Reserved 0 0 • 11 40512 Reserved 0 0 • Description EM3 Range EM2 Default Value EM1 Element Name • • • Automatically stores the current peak, average, and load factor results as a record in the non-volatile load factor log and resets the log at the specified day of the month. 0 = Disables the auto clear feature.
PowerMonitor 1000 Data Tables Appendix A Element No. Modbus Address Element Name Default Value Range TR1 TR2 EM1 EM2 EM3 Table 18 - Command Table Description 0 40601-2 Password 0 0…9999 • • • • • When writing the complete table this parameter allows the input data to be accepted. When writing a single parameter the separate password table should be used. Returns -1 on a read. 1 40603-4 Command Word 1 0 0…32 • • • • • These commands can be sent to the power monitor.
Appendix A PowerMonitor 1000 Data Tables Element Name Default Value Range EM2 EM3 4 40609-10 Status 1 Count x M Register Set Value 0 0… 9,999,999 • • • Status 1 Count Register Start Value x 1,000,000 5 40611-12 Status 1 Count X 1 0 Register Set Value 0… 999,999 • • • Status 1 Count Register Start Value x 1 6 40613-14 Status 2 Count x M Register Set Value 0… 9,999,999 • • • Status 2 Count Register Start Value x 1,000,000 7 40615-16 Status 2 Count X 1 0 Register Set Value 0…
PowerMonitor 1000 Data Tables Appendix A Table 19 - Log Request Table Parameters CSP File No. N17 CIP Instance 10 No. of Elements 11 No. of Words 11 Data Type Integer Data Access Read/Write Element No. Modbus Address Element Name Default Value Range TR1 TR2 EM1 EM2 EM3 Table 20 - Log Request Table Description 0 40701 Selected Log 0 0…5 • • • • • Selects the log that information is returned from.
Appendix A PowerMonitor 1000 Data Tables Range 5 40706 Number of Time of Use Log Records - 1…13 6 40707 Number of Load Factor Log Records - 1…13 7 40708 Load Factor or TOU Record to be Returned. - 0…13 • • Description EM3 Default Value EM2 Element Name EM1 Modbus Address TR1 Element No. TR2 Table 20 - Log Request Table • • • On a read of this table the value of this parameter is the number of Time of Use Log Records available.
PowerMonitor 1000 Data Tables Appendix A Table 21 - Controller Interface Table Parameters CSP File No. N18 CIP Instance 11 Applies to EM2, EM3 only No. of Elements 8 No. of Words 8 Data Type Integer Data Access Write Table 22 - Controller Interface Table Element No. Modbus Address Element Name Default Value Range Description 0 40801 Password 0 0…9999 When writing the complete table this parameter allows the input data to be accepted.
Appendix A PowerMonitor 1000 Data Tables Table 23 - Discrete Results Parameters CSP File No. N19 CIP Instance 12 Applies to All models No. of Elements 6 No. of Words 6 Data Type Integer Data Access Read Table 24 - Discrete Results Element No. Modbus Address Element Name Range Description 0 30001 Status Input States 0…3 Indicates the current states of the status input.
PowerMonitor 1000 Data Tables Appendix A Table 25 - Wiring Diagnostics Results Parameters CSP File No. F20 CIP Instance 13 No. of Elements 21 No. of Words 42 Data Type Float Data Access Read Element No. Modbus Address Element Name TR1 TR2 EM1 EM2 EM3 Table 26 - Wiring Diagnostics Results Units Range Description 0 30101-2 Wiring Status 0…5 • • • • • This is the overall status of the wiring diagnostic test.
Appendix A PowerMonitor 1000 Data Tables Element No. Modbus Address Element Name TR1 TR2 EM1 EM2 EM3 Table 26 - Wiring Diagnostics Results 4 30109-10 Current Input Inverted -1…123 • • • • • Reports on all three phases. -1 = Test not run. 0 = Test passed.
PowerMonitor 1000 Data Tables Appendix A Units Range TR2 Description 18 30137-38 Current Phase 3 Magnitude Amperes 0…9,999,999 • • 19 30139-40 Degrees out of range 0…360 • • • 20 30141-42 Reserved 0 • • • EM3 Element Name EM2 Modbus Address EM1 Element No. TR1 Table 26 - Wiring Diagnostics Results • Shows the present magnitude of this phase. • • When Status = 5, how many degrees out of range.
Appendix A PowerMonitor 1000 Data Tables Table 29 - Power Results Parameters CSP File No. F22 CIP Instance 15 No. of Elements 17 No. of Words 34 Data Type Float Data Access Read Table 30 - Power Results 30301-2 L1 True Power Factor -100.0…+100.0 • • 1 30303-4 L2 True Power Factor -100.0…+100.0 • • 2 30305-6 L3 True Power Factor -100.0…+100.0 • • 3 30307-8 3 Phase True Power Factor -100.0…+100.0 • • 4 30309-10 L1 kWatts +/- 0.
PowerMonitor 1000 Data Tables Appendix A Table 31 - Energy Results Parameters CSP File No. F23 CIP Instance 16 No. of Elements 19 No.
Appendix A PowerMonitor 1000 Data Tables Table 33 - Demand Results Parameters CSP File No. F24 CIP Instance 17 No. of Elements 9 No. of Words 18 Data Type Float Data Access Read Range EM3 0 30501-2 kWatt Demand +/- 0.000…9,999,999 • • The average real power during the last demand period. 1 30503-4 kVAR Demand +/- 0.000…9,999,999 • • The average reactive power during the last demand period. 2 30505-6 kVA Demand 0.
PowerMonitor 1000 Data Tables Appendix A Table 35 - Unit Status Log Results Parameters CSP File No. N25 CIP Instance 18 Applies to All models No. of Elements 13 No. of Words 13 Data Type Integer Data Access Read Table 36 - Unit Status Log Results Element No. Modbus Address Element Name Range Description 0 30601 Status Record Internal Identifier 1…50 Used to verify record sequence when returning multiple records.
Appendix A PowerMonitor 1000 Data Tables Table 37 - Unit Status Log Codes Status Event Type (Decimal) Event # General Code (Decimal) Code # Self Test Status 1 Pass 0 Flash Memory 1 Code # Overall Status 1 Boot Code Checksum 2 Application Code Checksum 4 Calibration Data CRC 8 No Calibration Data 16 Wrong Application FRN 32 Invalid Model Type 64 WIN Mismatch 128 Missing Upgrade Block 256 SRAM 2 Failed Read/Write Test 1 NVRAM 4 Failed Read/Write Test 1 SPI Interface 8
PowerMonitor 1000 Data Tables Appendix A Table 37 - Unit Status Log Codes Status Event Type (Decimal) Event # General Code (Decimal) Code # Configuration Changed 2 Clock Set 1 Status Input Counter Set 2 Log Cleared or Set KYZ Forced Status Input Activated Status Input Deactivated Energy Register Rollover 4 8 16 32 64 Device Power Up 128 Device Power Down 256 Factory Defaults Restored 4 Energy Register Set 8 Terminal Locked 16 Terminal Unlocked 32 Min/Max Log Cleared 1 Energy Lo
Appendix A PowerMonitor 1000 Data Tables Table 38 - Energy Log Results Parameters CSP File No. F26 CIP Instance 19 No. of Elements 21 No. of Words 42 Data Type Float Data Access Read Table 39 - Energy Log Results 0 30701-2 Internal Record Identifier.
PowerMonitor 1000 Data Tables Appendix A Table 40 - Write Error Status Results Parameters CSP File No. N27 CIP Instance 20 Applies to All Models No. of Elements 3 No. of Words 3 Data Type Integer Data Access Read Table 41 - Write Error Status Results Element No. Modbus Address Element Name Range Description 0 30801 Table Number or Instance All Write Enabled Tables Indicates the last table that was written.
Appendix A PowerMonitor 1000 Data Tables Table 42 - Unit Run Status Results Parameters CSP File No. N28 CIP Instance 21 Applies to All models No. of Elements 25 No. of Words 25 Data Type Integer Data Access Read Table 43 - Unit Run Status Results Element No. Modbus Address Element Name Range Description 0 30901 Bulletin Number 1408 Always returns 1408 1 30902 Series Letter 0…8 Indicates the unit hardware series letter, for example. 0=A 1=B . .
PowerMonitor 1000 Data Tables Appendix A Table 43 - Unit Run Status Results Element No. Modbus Address Element Name Range Description 9 30910 Flash Memory 0…511 0 indicates normal operation.
Appendix A PowerMonitor 1000 Data Tables Table 44 - Min/Max Log Results Parameters CSP File No. F29 CIP Instance 22 No. of Elements 11 No. of Words 22 Data Type Float Data Access Read Range TR2 0 31001-2 Parameter Being Returned 1…35 • • • Indicates the Parameter Number (See Min/ Max Parameter List). 1 31003-4 MIN Value +/0.000…9,999, 999 • • • The minimum value recorded for parameter being returned since the last clear command. 2 31005-6 MAX Value +/0.
PowerMonitor 1000 Data Tables Appendix A Table 46 - Min/Max Parameter List No.
Appendix A PowerMonitor 1000 Data Tables Table 47 - Load Factor Log Results Parameters CSP File No. F30 CIP Instance 23 No. of Elements 14 No. of Words 28 Data Type Float Data Access Read Range EM3 0 31101-2 Record Number 1…13 • • The record number of this data. 1 31103-4 End Date yy/mm/dd - • • The date that this record was stored. 2 31105-6 Elapsed Time 0.000… 9,999,999 • • Amount of time (in hours) that has elapsed since the last clear of the peak and average values.
PowerMonitor 1000 Data Tables Appendix A Range EM3 9 31119-20 Peak Demand kVA 0.000… 9,999,999 • • The largest magnitude demand for kVA that occurred over all of the demand intervals since the last clear command or auto-clear day. 10 31121-22 Average Demand kVA 0.000… 9,999,999 • • A running average of demand for kVA from the end of each demand period since the last clear command or auto-clear day. 11 31123-24 Load Factor kVA 0…100% • • Average Demand kVA / Peak Demand kVA.
Appendix A PowerMonitor 1000 Data Tables Table 49 - Time of Use Log Results - Real Energy and Demand Parameters CSP File No. F31 CIP Instance 24 No. of Elements 12 No. of Words 24 Data Type Float Data Access Read Element Name Range EM2 EM3 0 31201-2 Record Number 1…13 • • • The record number of the log. Record 0 is always the current record before being logged. 1 31203-4 Time Stamp Start Date (yy/mm/dd) - • • • The Date this record was started.
PowerMonitor 1000 Data Tables Appendix A Table 51 - Time of Use Log Results - Reactive Energy and Demand Parameters CSP File No. F32 CIP Instance 25 No. of Elements 12 No. of Words 24 Data Type Float Data Access Read Element Name Range EM2 EM3 Description 0 31301-2 Record Number 1…13 • • • The record number of the log. Record 0 is always the current record before being logged. 1 31303-4 Time Stamp Start Date (yy/mm/dd) - • • • The Date this record was started.
Appendix A PowerMonitor 1000 Data Tables Table 53 - Time of Use Log Results - Apparent Energy and Demand Parameters CSP File No. F33 CIP Instance 26 No. of Elements 12 No. of Words 24 Data Type Float Data Access Read Element Name Range EM2 EM3 0 31401-2 Record Number 1…13 • • • The record number of the log. Record 0 is always the current record before being logged. 1 31403-4 Time Stamp Start Date (yy/mm/dd) - • • • The Date this record was started.
PowerMonitor 1000 Data Tables Appendix A Table 55 - Catalog Number and WIN Parameters CSP File No. N34 CIP Instance 27 Applies to All models No. of Elements 19 No. of Words 19 Data Type Integer Data Access Read Table 56 - Catalog Number and WIN Element No.
Appendix A PowerMonitor 1000 Data Tables Table 57 - Single-element Password Write Parameters CSP File No. N35 CIP Instance 28 Applies to All models No. of Elements 1 No. of Words 1 Data Type Integer Data Access Write Table 58 - Single-element Password Write Element No. Modbus Address Element Name Range Description 0 40901 Password 0…9999 A write of this table allows any configuration parameter to be written as a single element or poke.
PowerMonitor 1000 Data Tables Appendix A Table 59 - User-configurable Table Setup Parameters CSP File No. N44 CIP Instance 29 Applies to EM3 only No. of Elements 17 No. of Words 17 Data Type Integer Data Access Read/Write Table 60 - User-configured Table Setup Element No. Modbus Address Element Name Default Value Range Description 0 41001 Password 0 0…9999 Required for configuration, returns -1.
Appendix A PowerMonitor 1000 Data Tables Table 61 - Parameters for Configurable Table Parameter No. Parameter Name Description 0 None No Parameter. 1 Date: Year Refer to Date and Time Configuration table. 2 Date: Month 3 Date: Day 4 Time: Hour 5 Time: Minute 6 Time: Seconds 7 Time: Hundredths 8 Status Input States 9 Output Word 10 Wiring Status 11 Voltage Input Missing Refer to Wiring Diagnostics Results table.
PowerMonitor 1000 Data Tables Appendix A Table 61 - Parameters for Configurable Table Parameter No. Parameter Name Description Refer to Volts, Amps, Frequency Results table.
Appendix A PowerMonitor 1000 Data Tables Table 61 - Parameters for Configurable Table Parameter No. Parameter Name Description 70 kWatth Net Refer to Energy Results table. 71 GVARH Fwd 72 kVARh Fwd 73 GVARH Rev. 74 kVARh Rev. 75 GVARH Net 76 kVARh Net 77 GVAh Net 78 kVAh 79 kWatt Demand 80 kVAR Demand 81 kVA Demand Refer to Demand Results table.
Appendix B SCADA Applications This section covers RSLinx driver setup, and OPC setup using the RSLinx OPC Server. RSLinx Classic Drivers Configuration The PowerMonitor 1000 unit EDS file should be installed on the computer running RSLinx software before configuring drivers. RSLinx software supports DF1 half-duplex, DF1 full-duplex, and EtherNet/IP network communication.
Appendix B SCADA Applications Configure DF1 Full-duplex You need to use a RS232 to RS485 converter, like the 1761-NET-AIC or B&B Electronics Converter – Model 485SD9TB. 1. Create a RS232 DF1 devices driver in RSLinx software. 2. Perform an Auto-configure. 3. Verify connections if Auto-configure fails. 4. Perform an RSWho to verify that RSLinx software is communicating to the power monitor. RSLinx software driver configuration is complete.
SCADA Applications Appendix B Configure EtherNet/IP Network Using Ethernet Devices Driver 1. Create an Ethernet devices driver in RSLinx software. 2. Add the IP address of the power monitor to the driver station mapping. 3. Perform an RSWho to verify that RSLinx software is communicating to the power monitor. RSLinx software driver configuration is complete. Configure EtherNet/IP Network Using EtherNet/IP Driver 1. Create an Ethernet/IP driver in RSLinx software. 2.
Appendix B SCADA Applications This configuration window appears. 3. Click New. This creates a topic in the left hand pane. 4. Name the topic pertinent to your application.
SCADA Applications Appendix B 5. In the right hand pane, under the Data Source tab, browse to your power monitor. You may use a serial or Ethernet network driver. TIP When using a DH485 driver, change the connection type to local addressing mode in the Advanced Communication tab. This is especially important when several topics use the DH485 driver. 6. Make sure that the topic is highlighted in the left pane, and that the power monitor is also highlighted in the right pane, then click Apply. 7.
Appendix B SCADA Applications 8. From the Processor Type menu, choose SLC 503+. 9. Click Done. OPC Topic configuration is complete. You can now use the RSLinx OPC Server, and the topic just created, to serve data to your application. OPC item addresses are of the format [OPC Topic Name]Address,Ln,C1 where Address is the power monitor data address (example: F21:7). Optional argument Ln is the length of the array requested in elements.
SCADA Applications Appendix B Browse OPC Tags The power monitor supports OPC tag browsing. The example uses the RSI OPC Test Client to illustrate tag browsing. 1. Open the RSI Test Client and connect to the RSLinx Classic OPC Server. 2. Add a group, then add an item. Browse to the OPC topic and then to the table and element in the Online tags. In this example, the User Configured Read Instance F9, element 8, in the OPC topic EM3_LAB is selected.
Appendix B SCADA Applications 3. Click OK and start viewing data. User-configured Data Table The 1408-EM3 model provides a user configured data table. You may select the 16 floating-point parameters that comprise this table. Your application may read this table as connected input instance 1, or as CSP file F9 using explicit messaging. Setup You must use serial or Ethernet network communication to set up and read the user configured data table.
SCADA Applications Appendix B Reading the User Configured Table as Connected Instance 1 The following example illustrates the steps required to set up an I/O connection between a Logix controller and the user configured Instance 1. The example uses a CompactLogix controller and RSLogix 5000 software. Follow these steps to configure the connection. 1. Open an offline project in RSLogix 5000 software. 2. Open the Ethernet network interface and select the Ethernet network. 3.
Appendix B SCADA Applications Do not enter an RPI less than 50 mS. 6. Click OK, then Save and download the offline project into the controller. The data from the user configured table is read into the controller tag [Module Name]:I.Data without any further logic programming, at the selected RPI rate. A power monitor connected instance may be owned by only one controller. An error results if you attempt to establish a connection with more than one controller.
Appendix C Specifications Technical Specifications Table 62 - Technical Specifications - 1408-TR1A-xxx, 1408-TR2A-xxx, 1408-EM1A-xxx, 1408-EM2A-xxx, 1408-EM3A-xxx Attribute Accuracy in % of Reading at 25 °C (77 °F) 50/60 Hz Unity Power Factor Nominal / Range Applies to TR1 TR2 Voltage sense ±0.5% inputs: V1, V2, V3 X X X Line-neutral rms: 347V / 15…399V Line-line rms: 600V / 26…691V Current sense input: I1, I2, I3 ±0.5% X X X 5A / 0.05…10.0A rms Frequency ±0.
Appendix A Specifications Table 63 - Input and Output Specifications - 1408-TR1A-xxx, 1408-TR2A-xxx, 1408-EM1A-xxx, 1408-EM2A-xxx, 1408-EM3A-xxx Attribute Value Control power 85…264V AC 47…63 Hz 125…250V DC 4 VA max Voltage sense inputs: V1, V2, V3 Input impedance: 5 M min Input current: 2 mA max Current sense inputs: I1, I2, I3 Overload withstand: 15 A continuous, 200 A for 1/2 s Burden: 0.05V A Impedance: 0.002 Max crest factor at 5 A is 3.
Appendix D Certifications The power monitor adheres to these certifications. EtherNet/IP Network Conformance Testing All power monitor products equipped with an EtherNet/IP network communication port bear the mark shown. This mark indicates the power monitor has been tested at an Open Device Vendor Association (ODVA) independent test lab and has passed the EtherNet/IP network conformance test.
Appendix A Certifications EN61000 – Immunity This product is intended for use in an industrial environment. Low Voltage Directive This product is tested to meet Council Directive 73/23/EEC Low Voltage, by applying the safety requirements of EN61010-1. This equipment is classified as open equipment and must be installed (mounted) in an enclosure during operation as a means of providing safety protection.
Index A additional resources 8 advanced configuration 71 analog input configuration 69, 70, 111 applications 10 B before you begin 7 billing and sub-billing 10 C calculating energy log depth 66 catalog number and WIN 109 change password 47 command table 82 commands 47 communication command summary 51 DH485 51 Modbus RTU serial 52 optional EtherNet/IP 51 optional Modbus/TCP Ethernet 52 serial DF1 full-duplex slave 51 serial DF1 half-duplex slave 51 communication overview 13 ethernet 14 serial 13 communicat
Index RSLogix5 message setup PLC5 or SLC typed read write 61 RSLogix500 message setup PLC5 or SLC typed read write 59 RSLogix5000 message configuration PLC5 or SLC typed read write 54 RSLogix5000 message setup CIP generic 56 setup 53 F features 10 hardware 11 functions 10 H 12 EM1 12 EM2 12 EM3 12 TR1 12 TR2 12 model types 10 EM1 10 EM2 10 EM3 10 TR1 10 TR2 10 modes display mode 16 edit mode 16, 21 program mode 16, 20 N hardware features 11 K KYZ output 12, 43 force 47 setup 44 L LCD interface butt
Index S safety 9 serial communication 13, 53 auto-sense 13 DF1 full-duplex 13 DF1 half-duplex 13 DH485 13 Modbus RTU 13 serial RS-485 port configuration 74 setup 15 analog inputs 25 demand 33 example use LCD 19 LCD screen 16 menu map 17 menu navigation 17 optionsl software 15 setup menus 24 use communication 24 use web interface 22 single element password write 110 software optional 15 specifications 125 status indicators 11 status input 12 status inputs 44 setup 45 T time of use log results apparent ener
Index Notes: 132 Rockwell Automation Publication 1408-UM001D-EN-P - September 2013
Rockwell Automation Support Rockwell Automation provides technical information on the Web to assist you in using its products. At http://www.rockwellautomation.com/support you can find technical and application notes, sample code, and links to software service packs. You can also visit our Support Center at https://rockwellautomation.custhelp.com/ for software updates, support chats and forums, technical information, FAQs, and to sign up for product notification updates.