
Manual

Heavy Duty Dynamic Braking 15
1336-5.64 — July, 2005
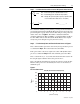
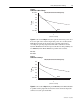
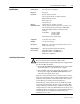
Figure 4
Power Curve Out of Range
Figure 4 is the result of Step 8. Note that a portion of the motor power curve
lies to the right of the constant temperature power curve of the Dynamic
Brake Resistor. This means that the resistor element temperature is
exceeding the operating temperature limit. This could mean a shorter
Dynamic Brake Resistor life than expected. To alleviate this possibility, use
two KB050 Dynamic Brake Modules in parallel and recalculate.
AL = 20%
PL = 400%
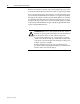
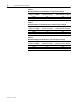
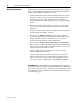
Figure 5
Power Curve In Range
Figure 5 is the result of Step 8 using two KB050 Dynamic Brake Modules
in parallel and the graph indicates that the resistive element temperature
will not exceed the operational limit.
t
(time in seconds)
100
AL = 32%
200
300
400
500
600
PL = 617%
102345678910
Power
(%)
KA, KB, KC Transient Power Capacity
Point 1
t
(time in seconds)
100
AL = 20%
200
300
PL = 400%
500
600
102345678910
Power
(%)
KA, KB, KC Transient Power Capacity
Point 1