
User Manual

WiNRADiO G3XX User’s Manual
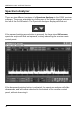
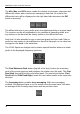
The button with a red round arrow selects continuous sweeping mode,
which means that the sweep will continue from the start frequency when the
end frequency is reached, and continue in this loop until manually stopped. If
this button is disengaged, the spectrum analyzer will be in a single shot
sweeping mode:
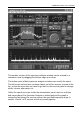
When the mouse cursor is positioned over the spectrum graph, a red cursor
will appear. Clicking anywhere on the spectrum graph tunes the receiver to the
corresponding frequency. You can also drag the mouse horizontally across the
spectrum and continuously tune the receiver.
The frequency corresponding to the cursor position, as well as the
corresponding signal level will be shown above the spectrum graph. In addition
to the frequency and level, minimum, maximum and their difference values are
also shown. These are values obtained throughout the entire time that the
spectrum analyzer is sweeping. Note that if the spectrum analyzer is in the
single-shot mode, the min and max values will be equal upon the termination
of the sweep.
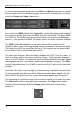
Right-clicking on the spectrum graph will cause a stationary blue vertical line,
the “marker” to appear over the graph. The marker can be either dragged
using the mouse, or repositioned by simply right-clicking on a new location.
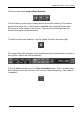
The marker can be made invisible by disengaging the Show Marker button:
The Show marker button gets activated automatically upon right-clicking on
the spectrum graph.
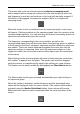
When the marker is activated, marker frequency and the associated trace
values will be displayed under the cursor values. If the marker delta mode is
activated using the Marker Delta Mode button, these values will become
differential with respect to values associated with the current position of the
cursor:
63