
User Guide

RS-Ruby Users’ Manual
28
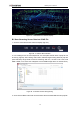
be displayed on the right side. It contains all displayed data points in the frame.
Figure B - 9. RSView Spreadsheet tool.
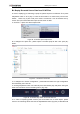
6. The dimension and the sort of data in this table are adjustable. That can make the
display more obvious. (Fig. B-10)
Figure B - 10. RSView Data Point Table.
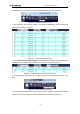
7. Click “Show only selected elements” in spreadsheet can acquire corresponding data,
certainly there is no data shown in table, if no one point is selected. (Fig. B-11)
Figure B - 11. RSView Show Only Selected Elements.
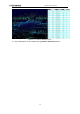
8. By using “Select All Points” Tool, the arbitrary point can be selected. (as shown in fig.
B-12)
Figure B - 12. RSView Select All Points.
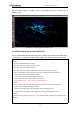
9. In the 3D rendered data pane using mouse to draw a rectangle around a small number
of points. The values of them can be immediately shown in the table (Fig. B-13).