
User Guide


RS-LiDAR-16 User Manual
53
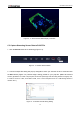
Figure C - 8: RSView Play Button.
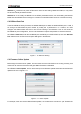
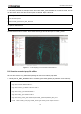
5. To take a closer look at some data, scrub to an interesting frame and click the Spreadsheet button
(Figure C-9). A sidebar of tabular data is displayed to the right of the rendered frame, containing all data
points in the frame.
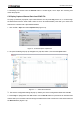
Figure C - 9: RSView Spreadsheet Tool.
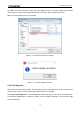
6. Adjust the columns to get a better view of the numbers. If you’ve adjusted columns in Excel, some of
this will be familiar. You can change column widths by dragging the column header divider left or right,
and by double-clicking them. Drag column headers left or right to reorder them. Sort the table by clicking
column headers. And you can make the table itself wider by dragging the table’s sides left or right. Make
Points_m_XYZ wider to expose the XYZ points themselves.
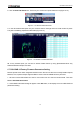
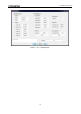
Figure C - 10: RSView Data Point Table.
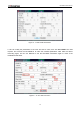
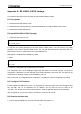
7. Click Show only selected elements in the Spreadsheet (Figure C-11). Since no points are selected
yet, the table will be empty.
Figure C - 11: RSView Show Only Selected Elements.