SDM-2012 Docking Station PC Controlled Configuration Operator’s Manual Part Number: 71-0256RK Revision: C Released: 8/12/13 www.rkiinstruments.
Warranty RKI Instruments, Inc. warrants gas alarm equipment sold by us to be free from defects in materials and workmanship, and performance for a period of one year from date of shipment from RKI Instruments, Inc. Any parts found defective within that period will be repaired or replaced, at our option, free of charge.
Table of Contents Introduction . . . . . . . . . . . . . . . . . . . . . . . . . . . . . . . . . . . . . . . . . . . . . . . . . . . . . . . . . . 1 System Requirements . . . . . . . . . . . . . . . . . . . . . . . . . . . . . . . . . . . . . . . . . . . . . . . . . . 2 Specifications. . . . . . . . . . . . . . . . . . . . . . . . . . . . . . . . . . . . . . . . . . . . . . . . . . . . . . . . . 3 About This Manual. . . . . . . . . . . . . . . . . . . . . . . . . . . . . . . . . . . . . . . . . . . . . . .
Overview of the SDM-GX Docking Station PC Controller Program. . . . . . . . . . . . . 30 PC Controller Program Functions . . . . . . . . . . . . . . . . . . . . . . . . . . . . . . . . . . . . 30 Main Program Window . . . . . . . . . . . . . . . . . . . . . . . . . . . . . . . . . . . . . . . . . . . . 31 Control Buttons . . . . . . . . . . . . . . . . . . . . . . . . . . . . . . . . . . . . . . . . . . . . . . . . . . . . . . . . . 31 SDM-2012/Instrument Display Area . . . . . . . . . . . . . . . . . . . .
Memo Data . . . . . . . . . . . . . . . . . . . . . . . . . . . . . . . . . . . . . . . . . . . . . . . . . . . . 135 Bump Test Data. . . . . . . . . . . . . . . . . . . . . . . . . . . . . . . . . . . . . . . . . . . . . . . . . 138 Barhole Data . . . . . . . . . . . . . . . . . . . . . . . . . . . . . . . . . . . . . . . . . . . . . . . . . . . 141 Normal Operation Snap Log Data. . . . . . . . . . . . . . . . . . . . . . . . . . . . . . . . . . . 144 Leak Check Mode Snap Log Data . . . . . . . . . . . . .
Introduction This section briefly describes the SDM-2012 Docking Station, the Single Module Data Viewer Program, and the SDM-GX Docking Station PC Controller Program. This section also describes the SDM-2012 Docking Station PC Controlled Configuration Operator’s Manual (this document). Table 1 at the end of this section lists the SDM2012’s specifications.
CAUTION: The GX-2012 and Gas Tracer detect oxygen deficiency and elevated levels of oxygen, combustible gases, carbon monoxide, and hydrogen sulfide (GX-2012 only), all of which can be dangerous or life threatening. When using the GX-2012 or Gas Tracer, you must follow the instructions and warnings in the GX-2012 Operator’s Manual or Gas Tracer Operator’s Manual to assure proper and safe operation of the unit and to minimize the risk of personal injury.
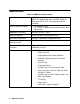
Specifications Table 1: SDM-2012 Specifications Input Power 12 VDC NOTE: AC Adapter with 100 - 240 VAC, 50/60 Hz, 0.6A input and 12 VDC, 1.2A output provided as standard.
About this Manual The SDM-2012 Docking Station PC Controlled Configuration Operator’s Manual uses the following conventions for notes, cautions, and warnings. NOTE: Describes additional or critical information. CAUTION: Describes potential damage to equipment. WARNING: Describes potential danger that can result in injury or death. Cautions & Safety Information • Use only polyurethane sample tubing with the SDM-2012. Consult RKI Instruments, Inc. for other materials.
Description This section describes the SDM-2012 docking station. It is designed to be used on a table top and consists of the AC adaptor, Type A to Type B USB cable, air filter, check valve, 3 plastic T-fittings, sample tubing, instrument panel, back panel, control panel, status LEDs, and 2 USB ports. AC Adapter Single-Port AC Adapter The single-port AC adapter is a wall plug style adapter with a 5 foot cable. The end of the cable has a plug that connects to the power jack on the SDM-2012’s back panel.
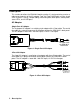
USB Cable A Type A to Type B USB cable is provided with the docking station. It is used to connect the USB port on the back of the SDM-2012 to a computer. Type A, for connection to PC USB port Type B, for connection to USB port on the SDM-2012's back panel Figure 3: USB Cable Air Filter, Sample Tubing, and Check Valve A cylindrical particle filter with a short length of tubing is supplied with the SDM-2012 for installation to the AIR fitting on the back panel.
A check valve is included with the SDM-2012. It is intended for use on the exhaust fitting when manifolding multiple docking stations together. See “Assembling a Manifold for Multiple SDM-2012 Units” on page 15 for manifolding instructions. Figure 5: Check Valve Three T-fittings are included with the SDM-2012. The larger fitting is for the exhaust tubing manifold construction. The two smaller fittings are for GAS 1 and GAS 2 tubing manifold construction.
Instrument Panel The instrument panel is on the top of the SDM-2012 and includes the instrument cradle, the IR port, the charging contacts, the exhaust line connection fitting, and the gas out to instrument line. The instrument cradle consists of two recessed areas and is designed to accept the instrument. The recess at the front of the instrument panel is for instruments that have a Li-ion battery pack installed. Charging contacts are located at the back of this recess.
Recess Cover Flap CHARGE GX-2012 OFF POWER BUMP CAL. EDIT ENTER COPY 1SEC ON 3SEC OFF SDM-2012 Figure 8: Instrument Panel with Alkaline Instrument Installed Recess Cover Flap CHARGE GX-2012 OFF POWER BUMP CAL.
Back Panel The back panel includes the power jack, sample fittings, and a USB PC connector. Exhaust Fitting Gas 1 Fitting Air Fitting Power Jack Back Panel USB Port (Type B), For Computer Connection Gas 2 Fitting Figure 10: Back Panel Power Jack The power jack is located in the bottom left corner of the back panel. The plug on the end of the AC adapter cable mates to it. Sample Fittings Four sample fittings are located on the back of the SDM-2012.
Control Panel The control panel is used to setup and operate the docking station in the Standalone configuration. It is located at the front of the docking station. It includes the control buttons, the control button LEDs, and the CHARGE status LED. CHARGE LED COPY LED CAL LED BUMP LED CHARGE GX-2012 OFF POWER BUMP EDIT ENTER CAL. COPY SDM-2012 1SEC ON 3SEC OFF Control Buttons Figure 11: Control Panel Five control buttons are located on the control panel.
Front Panel A type A USB port is located on the front of the docking station. This port can be used to save calibration and bump test data to a USB flash drive. This USB port is for use only in the Standalone configuration of the SDM-2012 and is not used in the PC Controlled configuration. Figure 12: Front Panel NOTE: The SDM-2012 does not support connection of a computer to the front USB port, only a USB flash drive.
Hardware Setup This section describes how to assemble the hardware that came with the SDM-2012, assemble a manifold, and connect calibration gas. Hardware Assembly The hardware assembly consists of connecting the AC adapter(s), installing the air filter(s), installing the check valve(s), connecting the sample tubing and connecting the USB cable(s). The SDM-GX Docking Station PC Controller software can support 1-10 SDM-2012 docking stations connected at the same time.
fitting, by pushing the open end of the exhaust tube onto the exhaust line connection fitting located in the upper left corner of the instrument panel. You may then push the black push on fitting of the exhaust line onto the exhaust line storage fitting on the other side of the instrument panel. Step 1: Open End Open End Black Push On Fitting SDM-2012 Step 2: Black Push On Fitting CHARGE GX-2012 OFF POWER RKI Instruments, Inc. BUMP CAL. EDIT ENTER COPY www.rkiinstruments.
8. Install the 3 foot long 3/16 inch ID tubes that are included with the SDM-2012 on the GAS 1 and GAS 2 fittings. GAS 1 and GAS 2 tubing from multiple units can be daisy chained together in a manifold for more convenient operation. See "Assembling a Manifold for Multiple SDM-2012 Units" below for instructions. 9. Connect the provided USB cord from the type B USB port on the back of the SDM-2012 to an available USB port on your computer or to a USB hub that is connected to your computer.
Figure 15: Exhaust Tubing Connections Hardware Setup • 16 AIR Unit 9 Unit 10 GAS1 GAS2 AIR 7 inches GAS2 GAS1 10 Foot Max Exhaust Tube To Open Area AIR Unit 2 GAS2 GAS1 Check Valve T-Fitting AIR Unit 1 GAS2 GAS1 9 inches
GAS 1 and GAS 2 Tubing NOTE: If you have only standard 4-gas GX-2012s, you do not need to assemble a GAS 2 manifold. For every other instrument configuration, a GAS 2 manifold does need to be assembled. NOTE: If you are planning to bump test or calibrate GX-2012s and Gas Tracers at the same time, create one manifold for the SDM-2012s that will test the GX-2012s and a separate manifold for the SDM-2012s that will test the Gas Tracers.
NOTE: The following instructions can also be applied to the AIR fitting if you are using a zero air cylinder and a humidifier tube to perform a WET air adjustment. 1. Connect a 6 inch humidifier tube to the GAS 2 fitting on the back of each SDM-2012. 2. Insert the smaller T-fittings into the open end of every humidifier tube except the last one so that the remaining two ports on the T-fitting are perpendicular to the GAS fitting. 3. Connect the last humidifier tube directly to the last T-fitting. 4.
Figure 16: Gas 1 Manifold Connections 19 • Hardware Setup AIR AIR Unit 7 Unit 6 GAS1 GAS2 AIR GAS2 GAS1 Unit 4 Unit 5 GAS1 GAS2 AIR GAS2 GAS1 AIR AIR Unit 8 GAS2 GAS1 Unit 3 GAS2 GAS1 AIR AIR Unit 9 GAS2 GAS1 Unit 2 GAS2 GAS1 AIR AIR Unit 10 GAS2 GAS1 Unit 1 GAS2 GAS1
Figure 17: Gas 2 Manifold Connections Hardware Setup • 20 AIR AIR Unit 7 Unit 6 GAS1 GAS2 AIR GAS2 GAS1 Unit 4 Unit 5 GAS1 GAS2 AIR GAS2 GAS1 AIR AIR Unit 8 GAS2 GAS1 Unit 3 GAS2 GAS1 AIR AIR Unit 9 GAS2 GAS1 Unit 2 GAS2 GAS1 AIR AIR Unit 10 GAS2 GAS1 Unit 1 GAS2 GAS1
Figure 18: Gas Tracer Humidifier Manifold 21 • Hardware Setup AIR Unit 10 GAS2 GAS1 AIR Unit 9 GAS2 GAS1 AIR Unit 2 GAS2 GAS1 AIR Unit 1 GAS2 GAS1
Connecting Calibration Gas The GAS 1 and GAS 2 fittings on the back of the docking station are designed to be used with a calibration gas cylinder that is fitted with a demand flow regulator. The AIR fitting may be used with a demand flow regulator and a cylinder of zero emissions air, but this is not normally necessary since the docking station will generally be in a fresh air area.
Table 2: Recommended Gas Cylinders Typical Instrument Types ppm CH4/LEL CH4/%vol CH4/Oxy/CO (Gas Tracer) Recommended Calibration Gas Cylinder(s) • 3-gas mix with CH4/Oxy/CO • 1000 ppm CH4 • 100% volume CH4 To connect calibration gas to the SDM-2012, do the following: 1. If the area around the docking station is not considered a fresh air area (an area free of combustible and toxic gases and of normal oxygen content, 20.
Installing the SDM-GX Docking Station PC Controller Software 1. Launch Windows®. 2. Exit from all applications and open windows. 3. There are two ways to install the SDM-GX Docking Station PC Controller Software: by using the SDM-2012 product CD or by using the SDM-GX Docking Station PC Controller Software Installation CD. • If you are using the SDM-2012 Product CD, insert the Product CD into your computer’s CD-ROM drive. The CD will automatically open revealing several folders.
11. A Device Driver Window will appear prompting you to install necessary drivers. You cannot continue the installation without installing the drivers. Figure 19: Device Driver Installation 12. Click Next to install the drivers. The Wizard will find the appropriate drivers. 13. If this is the first time you are installing a PC Controller Program, a window will appear saying that the file did not pass Windows logo testing. Click Continue Anyway.
14. Click Finish once the drivers are successfully installed. Figure 20: Finish Device Driver Installation The installation will continue. 15. Follow the on-screen instructions to complete software installation. 16. To complete the driver installation, ensure that all of your docking stations are connected to your computer. 17. Turn on a docking station by pressing and holding the POWER button for at least 1 second.
18. The first time an SDM-2012 is turned on after being connected to the computer, a Found New Hardware window will appear. NOTE: The following instructions do not apply to computers running Windows Vista or Windows 7. The hardware driver will automatically install and you will be notified that the USB device is ready for use. Figure 21: Found New Hardware Wizard 19. Select the “Install the software automatically” option and click Next.
20. The wizard will search for the driver files. Figure 22: Searching 21. Once the files have been found, a window will appear saying that the file did not pass Windows logo testing. Click Continue Anyway. Figure 23: Windows Logo Error 22. The installation will continue. Click Finish when the installation has completed. 23. Repeat steps 17 through 22 for every docking station in your system.
Launching the SDM-GX Docking Station PC Controller Program 1. Click Start on the Windows Icon Tray, then select Programs/SDM-GX Docking Station PC Controller. You may also double click the shortcut created on your desktop. The SDM-GX Docking Station PC Controller Program is launched and the main program window appears. Figure 24: Main Program Window 2. If you are starting the software for the first time, a message window appears informing you that a database has been created. Click OK in that window.
Overview of the SDM-GX Docking Station PC Controller Program This section provides a brief overview of the program and a description of the main program window. Instructions for using the program are given in other parts of this manual. Use this section to become familiar with the main program window, but before attempting to use the program, make sure to perform the program setup as described in “Setting Up the PC Controller Program” on page 32.
Main Program Window The main program window is where the current status of the program operation is shown. Any SDM-2012s and instruments that are currently connected to it and any instruments that have previously been but are not currently connected to it are also shown. The program’s various functions are initiated or accessed from this screen. The current date and time are always displayed in the lower right corner of the main program window.
instruments that are in the database. The SDM-2012s are identified by a number. The instruments are identified by their serial number. By selecting either the Icon radio button or the Details radio button, the SDM-2012s and instruments can be displayed either as icons or in a table format that shows various instrument parameter details such as station ID, user ID, the next scheduled bump test date, and the next scheduled calibration date among others.
2. The configuration parameters are located in the Configuration Window of the SDM-GX Docking Station PC Controller program. To access the Configuration Window, click the Config button along the top of the main program window. 3. You will be prompted to enter a password. The factory set password is ABCDE. Enter the password and click OK keeping in mind that the password is case sensitive. You may change the password using the Password Tab once you have entered the Configuration Window.
5. Select the Instrument Information options. • Change Parameter If Change Parameter is selected (factory setting), the Edit function is active in the Instrument Function Menu allowing you to change various parameters in connected instruments. See “Edit Function” on page 155 for a complete description of the Edit function. If it is not selected, the Edit function is not active. Select or deselect the Change Parameter box.
program will reset the numbers it has assigned to specific docking stations and reassign them as you turn SDM-2012 docking stations on and connect them to the program. See “Setting Up the SDM-2012 Display Order” on page 38 for instructions to use this feature. 8. Select the Calibration options. In the Calibration section of the Parameter Tab, you can select Manual Calibration or Auto Calibration.
related to the bump test functionality of the SDM-2012. • Manual Bump Test/Auto Bump Test You can select Manual Bump Test or Auto Bump Test. If Manual Bump Test is selected, you have to manually select an instrument or instruments in the main program window and click Bump Test in the lower right corner of the window in order to perform a bump test.
setting and type in the desired value. The value you type in must be valid (between 1 and 30). • Gas Exposure Time The Gas Exposure Time can be set to 30 (factory setting), 45, 60, 90, 120 seconds or Auto and is the length of time that gas is applied to the instrument. If you select Auto, the PC Controller program will apply gas for the appropriate amount of time based on your instrument sensor configurations. To change the Gas Exposure Time, click on the current setting. A drop down menu will appear.
Setting Up the SDM-2012 Display Order Setting up the display order for your SDM-2012s ensures that the docking stations will appear in the PC Controller program in the same order that they are laid out in your calibration area. Before performing this operation, make sure your SDM-2012s are arranged on the table top or other surface as desired and that they are connected to the computer. See “Hardware Setup” on page 13.
4. Click the box next to Initialize Display Order in the SDM portion of the Parameter tab. 5. Click OK. 6. The program will ask if you want to save the changes. Click Yes. 7. A window will appear informing you that you need to turn off all SDMs and restart the program. Click OK. 8. Click the Exit button in the upper right corner of the main program window to exit the program. 9. Turn off all of the SDM-2012s if they are on. 10. Open the SDM-GX Docking Station PC Controller program again. 11.
Cylinders Window The Cylinders Window allows you to keep track of cylinders that are in use and the expiration date for those cylinders. If a cylinder’s expiration date has passed, the PC Controller program will alert you in the message area of the main program window as soon as the program is started. The Cylinders window comes with a list of predefined cylinders that are fairly common. If a cylinder that you need to use is not on this list, it can be added at the bottom of the cylinder list.
2. Click in a Name field, click on the drop down menu that appears, and select a predefined cylinder. Figure 29: Predefined List of Cylinders 3. Set the expiration date by clicking in the Expiration field and clicking the drop down menu that appears. Use the calendar to choose an expiration date. The expiration date box will be highlighted in orange if the expiration date of the cylinder is less than 10 days away. The expiration date box will be highlighted in red if the expiration date has passed. 4.
Defining New Cylinders If your instrument configuration requires the use of a cylinder that is not in the predefined list, you can add that cylinder by either typing in the information for the cylinder or by editing the information for an existing cylinder. 1. To access the Cylinders Window, click the Cylinders button along the top of the main program window. 2.
6. Select the Active box if you want the PC Controller program to alert you when the cylinder’s expiration date has passed. If you do not want the program to alert you, leave the box deselected. 7. To enter any more cylinders, repeat step 3 through step 6. 8. To return to the main program window without saving any changes, click Cancel in the Cylinders Window. A window will appear notifying you that changes will not be saved. To continue to the main program window, click OK.
3. NOTE: Install an instrument in the appropriate recess of the instrument cradle. The plastic flap should be covering the recess not in use. Flip the plastic flap over if it is covering the recess you need to use. If you are only charging an instrument or viewing or editing parameters, you do not need to connect the gas out to instrument line or the exhaust line to the instrument.
4. Turn on each SDM-2012 by pressing and holding the SDM-2012’s POWER button. When the control panel LEDs turn on, release the POWER button. 5. The BUMP T and CAL S LEDs will turn off and the COPY LED will be steadily on or off. It will be on if the SDM-2012 was used in Standalone Configuration and calibration and bump test records are still stored in the SDM-2012’s memory (see the SDM-2012 Docking Station Standalone Configuration Manual for more information).
8. Turn on each instrument by pressing and holding the POWER ENTER button on each instrument until you hear a beep, then release it. The instrument will begin its power up sequence (see exceptions below in step 9). If a successful connection between the instrument and the SDM-2012 occurs, the home screen will appear on the instrument display at the end of the start up sequence. The heart symbol will be flashing and the instrument display will appear as shown below depending on the connected instrument.
Press and release the POWER ENTER button on the instrument. If you do not press the POWER ENTER button for 20 seconds, the instrument will automatically continue its warm up sequence in Normal Mode. • When CL RMNDR is set to ON and CL EXPRD is set to NOT USE, if the instrument is due for calibration, it will show a calibration expired failure screen and the buzzer and LED arrays will pulse.
the date and time of the instrument are automatically updated to the current date and time on the PC Controller Program’s screen. NOTE: Turn each instrument on 10-15 seconds after the previous instrument to minimize the possibility of the instrument not connecting to the PC Controller Program. If an instrument does not connect and the pump continues to run, use the instrument’s POWER ENTER button to turn it off and turn it back on again.
Icon View vs. Details View Instruments that are currently connected or have been previously connected can be viewed in either Icon View or Details View. Choose Icon or Details View by clicking the Icon or Details radio button below the control buttons. Icon View allows you to view connected instruments and previously connected instruments in an icon configuration. Connected instruments are shown as an instrument inserted in an SDM-2012 icon. Previously connected instruments are shown as instrument icons.
Printing and Exporting an Instrument List from the Main Program Window You can print, save, or add to clipboard the instrument list in the main program window. You can only print the list if it is viewed in Details format. The list cannot be printed when viewed in Icon format. To print the instrument list: 1. Ensure that the main program window is being viewed in Details format.
To print the instrument list, click OK. To cancel the print job, click Cancel. To save the instrument list as a .csv file: 1. Click the Save icon located just below the Exit button. 2. Choose a file path and enter a file name and click Save. To save the instrument list to the clipboard: 1. Click the Clipboard button located just below the Exit button.
sensor installed cannot be fully bump tested or calibrated automatically because they will always need a gas cylinder change during bump testing or calibration. The PC Controller Program will bump test or calibrate only the standard 3 sensors (catalytic LEL, O2, and CO) if Auto Bump Test or Auto Calibration is selected. RKI Instruments, Inc.
GX-2012 is defined in the Parameter tab of the Configuration Window. See "Setting Up the Configuration" step 9 on page 35 for a description of the bump test configuration setup. To manually bump test an instrument or instruments: 1. Establish a connection between the SDM-2012, GX-2012, and the PC Controller program as described in “Connecting Instruments to the PC Controller Program” on page 43. 2. Verify that all of the bump test parameters are set correctly.
select the Force Calibration selection box. 7. Click the Bump test button in the lower right corner of the main program window. 8. You will be asked to confirm which GX-2012 channels will use GAS 1 for the bump test. The gas concentration shown next to each channel is the auto calibration value for that channel. If it does not match the gas concentration in the cylinder(s), change the auto calibration value for that channel. See “Sensor Tab” on page 165 for instructions.
9. You will then be asked to confirm the auto calibration values and the instruments that the calibration cylinder will be used for. Be sure the auto calibration values match the values listed on the calibration cylinder. The serial number and gas combination of all selected instruments will appear sequentially beneath the gas cylinder concentration. If you are bump testing a standard 4-gas GX-2012 or GX-2012s, the screen will appear as shown below. All channels will be bump tested using GAS 1.
If you are bump testing a standard 4-gas plus %volume GX-2012 or GX-2012s, the screen will appear as shown below. The standard 4 sensors will be bump tested using GAS 1 and the %volume sensor(s) will be bump tested using GAS 2. The GAS 2 selection box is deselected by default. You must select the GAS 2 box if you wish to bump test the %volume sensor. If you do not wish to bump test the %volume sensor, leave the GAS 2 box deselected.
11. The pump(s) will start and the program will indicate that air is flowing. The AIR indicator on the program screen will be on and air will be applied to the instrument(s) for 45 seconds, then the PC Controller Program will perform a zero adjustment on all the channels. The BUMP T LED on the SDM-2012 control panel will be flashing amber. If at any point during the bump test you wish to cancel the bump test, click the Cancel button in the lower right corner of the screen.
12. After air is applied, and if all the channels passed the zero adjustment, calibration gas will be applied. The GAS 1 indicator on the program screen will come on and calibration gas will be applied to the instrument(s) for the duration specified in the Gas Exposure Time parameter in the Configuration Window. Figure 41: GAS 1 Calibration Gas Flowing The PC Controller Program will analyze the results.
13. If you do not have a %volume sensor installed in your GX-2012(s), continue with step 14. If you have a %volume sensor installed, GAS 2 calibration gas will be applied to the instrument(s) for the duration specified in the Gas Exposure Time parameter in the Configuration Window. Figure 42: GAS 2 Calibration Gas Flowing The PC Controller Program will analyze the results.
14. After calibration gas is applied, the docking station will purge with fresh air for 45 seconds.
15. After the fresh air purge is complete, • If the bump test passes, the following window will open indicating that. The BUMP T LED will be solid green. Click OK to return to the main program window. The BUMP T LED will turn off. Figure 44: Bump Test Passed The GX-2012 will automatically be shut off 20 seconds after a successful bump test.
• If the bump test fails and the Force Calibration box was not selected, the following window will open indicating which channels failed the bump test. The BUMP T LED on the SDM-2012 control panel will be solid red. Click OK to return to the main program window or double click the instrument information line to view the bump test results in the Logs window. The BUMP T LED on the SDM-2012 control panel will turn off.
• If the bump test fails and the Force Calibration box was selected, the SDM-2012 automatically performs a calibration immediately after the failed bump test. The results screen will indicate the results of both the bump test and calibration. The BUMP T LED on the SDM-2012 control panel will be solid red. The CAL S LED will be solid green if the calibration passed or solid red if the calibration failed.
• If at any point during the bump test the flow rate to the instrument becomes too low, the PC Controller Program will abort the bump test and display a failed bump test screen. The BUMP T LED on the SDM-2012 control panel will be solid red. Click OK to return to the main program window or double click an instrument information line to view the bump test or calibration results in the Logs window. The BUMP T LED on the SDM2012 control panel will turn off.
Calibrating a GX-2012 The following instructions apply to GX-2012s with one or more of the standard four sensors (catalytic LEL, O2, H2S, and CO) when you are using only a 3-gas or 4-gas cylinder. RKI Instruments, Inc. recommends using a 3-gas or 4-gas cylinder instead of multiple cylinders for calibrating standard instruments. These instructions also apply to GX-2012s with a %volume sensor installed when you are using a 3-gas or 4gas mix and a %volume calibration cylinder.
5. Select the instrument or instruments you wish to calibrate and click on them to highlight them as shown below. To select more than one instrument for calibration, hold down the Control button on the keyboard as you click them. Figure 48: Instrument Selection 6. Click the Calibration button in the lower right corner of the main program window.
7. You will be asked to confirm which GX-2012 channels will use GAS 1 for the calibration. The gas concentration shown next to each channel is the auto calibration value for that channel. If it does not match the gas concentration in the cylinder(s), change the auto calibration value for that channel. See “Sensor Tab” on page 165 for instructions. When using a 3-gas (no H2S channel) or a 4-gas (H2S channel included) cylinder, to calibrate a standard instrument, select all channels.
8. You will then be asked to confirm the auto calibration values and the instruments that the calibration cylinder will be used for. Be sure the auto calibration values match the values listed on the calibration cylinder. The serial number and gas combination of all selected instruments will appear sequentially beneath the gas cylinder concentration. If you are calibrating a standard 4-gas GX-2012 or GX-2012s, the screen will appear as shown below. All channels will be calibrated using GAS 1.
If you are calibrating a standard 4-gas plus %volume GX-2012 or GX-2012s, the screen will appear as shown below. The standard 4 sensors will be calibrated using GAS 1 and the %volume sensor(s) will be calibrated using GAS 2. The GAS 2 selection box is deselected by default. You must select the GAS 2 box if you wish to calibrate the %volume sensor. If you do not wish to calibrate the %volume sensor, leave the GAS 2 box deselected.
10. The pump(s) will start and the program will indicate that air is flowing. The CAL S LED will begin to flash amber. Air will be applied to the instrument(s) for 45 seconds, then the PC Controller Program will perform a zero adjustment on all the channels. If at any point during the calibration you wish to cancel the calibration, click the Cancel button in the lower right corner of the screen. The calibration will be aborted and the CAL S LED will turn solid amber.
11. After air is applied, and if all the channels passed the zero adjustment, calibration gas will be applied. The GAS 1 indicator on the program screen will come on. Calibration gas will be applied to the instrument(s) for 90 seconds. Figure 53: GAS 1 Calibration Gas Flowing The PC Controller Program will analyze the results.
12. If you do not have a %volume sensor installed in your GX-2012(s), continue with step 13. If you have a %volume sensor installed, GAS 2 calibration gas will be applied to the instrument(s) for 90 seconds. Figure 54: GAS 2 Calibration Gas Flowing The PC Controller Program will analyze the results.
13. After calibration gas is applied, the docking station will purge with fresh air for 45 seconds.
14. After the fresh air purge is complete, • If the calibration passes, the following window will open indicating that. The CAL S LED on the SDM-2012 control panel will be solid green. Click OK to return to the main program window. The CAL S LED will turn off. Figure 56: Calibration Passed The GX-2012 will automatically be shut off 20 seconds after a successful calibration.
• If the calibration fails, the following window will open indicating which channels failed to calibrate. The CAL S LED on the SDM-2012 control panel will be solid red. Click OK to return to the main program window or double click the instrument information line to view the calibration results in the Logs window. The CAL S LED on the SDM-2012 control panel will turn off.
• If at any point during the calibration the flow rate to the instrument becomes too low, the PC Controller Program will abort the calibration and display a failed calibration screen. The CAL S LED on the SDM-2012 control panel will be solid red. Click OK to return to the main program window or double click the instrument information line to view the calibration results in the Logs window. The CAL S LED on the SDM-2012 control panel will turn off.
Bump Testing a Gas Tracer The following instructions apply to standard Gas Tracers that contain the standard sensors (catalytic LEL, ppm combustible, O2, and CO). They also apply to Gas Tracers that have a %volume combustible gas sensor installed. See “Bump Testing a GX-2012” on page 52 for instructions to bump test a GX-2012. The PC Controller Program is capable of performing a bump test both manually and automatically when a Gas Tracer is connected to it.
Tracer. 5. Select the instrument or instruments you wish to bump test and click on them to highlight them as shown below. To select multiple instruments for bump testing, hold down the Control button on the keyboard as you click them. Figure 59: Instrument Selection 6. If you would like an automatic calibration to occur after a failed bump test, select the Force Calibration selection box. 7. Click the Bump test button in the lower right corner of the main program window.
8. You will be asked to confirm which Gas Tracer channels will use GAS 1 for the bump test. The gas concentration shown next to each channel is the auto calibration value for that channel. If it does not match the gas concentration in the cylinder(s), change the auto calibration value for that channel. See “Sensor Tab” on page 165 for instructions. If you are bump testing a standard Gas Tracer, leave the first channel (the ppm sensor) deselected and select all other channels.
If you are bump testing a 0 - 10000 ppm range Gas Tracer, the Gas Cylinder Confirmation Screen will appear as shown below. Even though there are no other sensors installed in the instrument, GAS 2 will still be used to bump test the ppm sensor. The ppm sensor will be deselected in this screen and cannot be selected. Figure 61: Gas Cylinder Confirmation Screen, 0 - 10000 ppm Gas Tracer When all of the desired channels are selected, click OK. If you don’t want to proceed, click Cancel to abort the bump test.
9. You will then be asked to confirm the auto calibration values and the instruments that the calibration cylinder will be used for. Be sure the auto calibration values match the values listed on the calibration cylinder. The serial number and gas combination of all selected instruments will appear sequentially beneath the gas cylinder concentrations. If you are bump testing a standard Gas Tracer or Gas Tracers (catalytic LEL, ppm combustible, O2, and CO), the screen will appear as shown below.
If you are bump testing a standard Gas Tracer plus a %volume sensor, the screen will appear as shown below and will indicate a gas cylinder change is needed. The ppm sensor will be bump tested first with GAS 2. The standard 3 sensors will then be bump tested using GAS 1. The %volume sensor will then be bump tested with GAS 2. The user must change the GAS 2 cylinder before the %volume sensor can be bump tested. The GAS 2 selection boxes are deselected by default.
If you are bump testing a 0 - 10000 ppm Gas Tracer, the screen will appear as shown below. The ppm sensor will be bump tested using GAS 2. The GAS 2 selection box is deselected by default. You must select the GAS 2 box to bump test the ppm combustible sensor. If you do not select the GAS 2 box, the bump test will not continue. Be sure that the ppm calibration cylinder is connected to the GAS 2 fitting with a 6 inch humidifier at the start of the bump test.
11. If a bump test or calibration has already been performed by the PC Controller program on a GX-2012 or a Gas Tracer with a %volume sensor installed, the docking station will perform a purge before beginning the bump test. The purge ensures that any %volume calibration gas does not come in contact with the ppm sensor and affect its readings. The screen will indicate that you need to remove the gas cylinder from the GAS 2 fitting on the back of the SDM2012.
15. The pump will start and the program will indicate that air is flowing. The AIR indicator on the program screen will be on. The BUMP T LED on the SDM2012 control panel will be flashing amber. Air will be applied to the ppm sensor for 45 seconds, then the PC Controller Program will perform a zero adjustment on the ppm channel. If at any point during the bump test you wish to cancel the bump test, click the Cancel button in the lower right corner of the screen.
16. After air is applied, and if the ppm sensor passed the zero adjustment, calibration gas from the GAS 2 cylinder will be applied to the ppm sensor. The GAS 2 indicator on the program screen will come on and calibration gas will be applied to the ppm sensor for the duration specified in the Gas Exposure Time parameter in the Configuration Window. Figure 66: GAS 2 PPM Gas Flowing The PC Controller program will analyze the results.
17. After calibration gas has been applied to the ppm sensor, fresh air will be applied to the standard 3 sensors (catalytic LEL, O2, and CO) and the %volume sensor (if installed) for 45 seconds and the PC Controller program will perform a zero adjustment. Figure 67: Air Flowing to Standard 3 Sensors The PC Controller Program will analyze the zero adjustment results. If any of the standard 3 sensors or %volume sensor (if installed) failed the zero adjustment, the bump test will be aborted.
18. After air is applied, and if all standard 3 channels and the %volume channel (if installed) passed the zero adjustment, calibration gas from the GAS 1 cylinder will be applied. The GAS 1 indicator on the program screen will come on and calibration gas will be applied to the instrument(s) for the duration specified in the Gas Exposure Time parameter in the Configuration Window. Figure 68: GAS 1 Flowing The PC Controller Program will analyze the results.
19. If you are not bump testing an instrument or instruments with a %volume sensor installed, continue to step 22. If you are bump testing an instrument or instruments with a %volume sensor installed, you will be prompted to change the GAS 2 cylinder. The pump(s) on the instrument(s) will stop. 20. Change the cylinder connected to the GAS 2 fitting to the %volume calibration cylinder. 21. When you have changed the GAS 2 cylinder, click OK.
automatically begin and GAS 2 calibration gas will continue to flow. 22. After GAS 2 calibration gas has been applied, the docking station will purge with fresh air for 45 seconds.
23. After the fresh air purge is complete, • If the bump test passes, the following window will open indicating that. The BUMP T LED will be solid green. Click OK to return to the main program window. The BUMP T LED will turn off. Figure 71: Bump Test Passed The Gas Tracer will automatically be shut off 20 seconds after a successful bump test.
• If the bump test fails and the Force Calibration box was not selected, the following window will open indicating which channels failed the bump test. The BUMP T LED on the SDM-2012 control panel will be solid red. Click OK to return to the main program window or double click the instrument information line to view the bump test results in the Logs window. The BUMP T LED on the SDM-2012 control panel will turn off.
• If the bump test fails and the Force Calibration box was selected, the SDM-2012 automatically performs a calibration immediately after the failed bump test. The results screen will indicate the results of both the bump test and calibration. The BUMP T LED on the SDM-2012 control panel will be solid red. The CAL S LED will be solid green if the calibration passed or solid red if the calibration failed.
• If at any point during the bump test the flow rate to the instrument becomes too low, the PC Controller Program will abort the bump test and display a failed bump test screen. The BUMP T LED on the SDM-2012 control panel will be solid red. Click OK to return to the main program window or double click an instrument information line to view the bump test or calibration results in the Logs window. The BUMP T LED on the SDM2012 control panel will turn off.
Calibrating a Gas Tracer The following instructions apply to standard Gas Tracers that contain the standard sensors (catalytic LEL, ppm combustible, O2, and CO). They also apply to Gas Tracers that have a %volume combustible gas sensor installed. See “Calibrating a GX-2012” on page 65 for instructions to calibrate a GX-2012. The PC Controller Program is capable of performing a calibration both manually and automatically on a Gas Tracer.
5. Select the instrument or instruments you wish to calibrate and click on them to highlight them as shown below. To select multiple instruments for calibration, hold down the Control button on the keyboard as you click them. Figure 75: Instrument Selection 6. Click the Calibration button in the lower right corner of the computer program screen.
7. You will be asked to confirm which Gas Tracer channels will use GAS 1 for the calibration. The gas concentration shown next to each channel is the auto calibration value for that channel. If it does not match the gas concentration in the cylinder(s), change the auto calibration value for that channel. See “Sensor Tab” on page 165 for instructions. If you are calibrating a standard Gas Tracer, leave the first channel (the ppm sensor) deselected and select all other channels.
If you are calibrating a 0 - 10000 ppm range Gas Tracer, the Gas Cylinder Confirmation Screen will appear as shown below. Even though there are no other sensors installed in the instrument, GAS 2 will still be used to calibrate the ppm sensor. The ppm sensor will be deselected in this screen and cannot be selected. Figure 77: Gas Cylinder Confirmation Screen, 0 - 10000 ppm Gas Tracer When all of the desired channels are selected, click OK.
not wish to calibrate the ppm combustible sensor, leave the GAS 2 box deselected. The SDM-2012 will calibrate the ppm sensor using the Gas Tracer’s WET setting for the fresh air adjustment and the span adjustment. This is not user adjustable using the PC Controller Program. If the SDM-2012 is not in a fresh air environment, a zero air cylinder must be used with a 6 inch humidifier tube connecting the cylinder to the AIR fitting.
If you are calibrating a standard Gas Tracer plus a %volume sensor, the screen will appear as shown below and will indicate a gas cylinder change is needed. The ppm sensor will be calibrated first with GAS 2. The standard 3 sensors will then be calibrated using GAS 1. The %volume sensor will then be calibrated with GAS 2. The user must change the GAS 2 cylinder before the %volume sensor can be calibrated. The GAS 2 selection boxes are deselected by default.
If you are calibrating a 0 - 10000 ppm Gas Tracer, the screen will appear as shown below. The ppm sensor will be calibrated using GAS 2. The GAS 2 selection box is deselected by default. You must select the GAS 2 box to calibrate the ppm combustible sensor. If you do not select the GAS 2 box, the calibration will not continue. Be sure that the ppm calibration cylinder is connected to the GAS 2 fitting with a 6 inch humidifier at the start of the calibration.
10. If a bump test or calibration has already been performed by the PC Controller program on a GX-2012 or a Gas Tracer with a %volume sensor installed, the docking station will perform a purge before beginning the calibration. The purge ensures that any %volume calibration gas does not come in contact with the ppm sensor and affect its readings. The screen will indicate that you need to remove the gas cylinder from the GAS 2 fitting on the back of the SDM2012.
14. The pump will start and the program will indicate that air is flowing. The AIR indicator on the program screen will be on. The CAL S LED will begin to flash amber. Air will be applied to the ppm sensor for 45 seconds, then the PC Controller Program will perform a zero adjustment on the ppm sensor. If at any point during the calibration you wish to cancel the calibration, click the Cancel button in the lower right corner of the screen.
15. After air is applied, and if the ppm sensor passed the zero adjustment, calibration gas from the GAS 2 cylinder will be applied to the ppm sensor. The GAS 2 indicator on the program screen will come on and calibration gas will be applied to the ppm sensor for 90 seconds. Figure 82: GAS 2 PPM Gas Flowing The PC Controller program will analyze the results.
16. After calibration gas has been applied to the ppm sensor, fresh air will be applied to the standard 3 sensors (catalytic LEL, O2, and CO) and the %volume sensor (if installed) for 45 seconds and the PC Controller program will perform a zero adjustment. Figure 83: Air Flowing to Standard 3 Sensors The PC Controller Program will analyze the zero adjustment results. If any of the standard 3 sensors or the %volume sensor (if installed) failed the zero adjustment, the calibration will be aborted.
17. After air is applied, and if all 3 channels and the %volume channel (if installed) passed the zero adjustment, calibration gas from the GAS 1 cylinder will be applied. The GAS 1 indicator on the program screen will come on. GAS 1 calibration gas will be applied to the instrument(s) for 90 seconds. Figure 84: GAS 1 Flowing The PC Controller Program will analyze the results. 18. If you are not calibrating an instrument or instruments with a %volume sensor installed, continue to step 22.
20. When you have changed the GAS 2 cylinder, click OK. The calibration will continue and the second GAS 2 calibration gas will be applied to the %volume sensor for 90 seconds. Figure 85: %Volume GAS 2 Flowing The PC Controller Program will analyze the results.
21. After calibration gas is applied, the docking stations will purge with fresh air for 45 seconds.
22. After the fresh air purge is complete, • If the calibration passes, the following window will open indicating that. The CAL S LED on the SDM-2012 control panel will be solid green. Click OK to return to the main program window. The CAL S LED will turn off. Figure 87: Calibration Passed The Gas Tracer will automatically be shut off 20 seconds after a successful calibration.
• If the calibration fails, the following window will open indicating which channels failed to calibrate. The CAL S LED on the SDM-2012 control panel will be solid red. Click OK to return to the main program window or double click the instrument information line to view the calibration results in the Logs window. The CAL S LED on the SDM-2012 control panel will turn off.
• If at any point during the calibration the flow rate to the instrument becomes too low, the PC Controller Program will abort the calibration and display a failed calibration screen. The CAL S LED on the SDM-2012 control panel will be solid red. Click OK to return to the main program window or double click the instrument information line to view the calibration results in the Logs window. The CAL S LED on the SDM-2012 control panel will turn off.
Troubleshooting NOTE: This troubleshooting guide describes SDM-2012 problems only. See the GX-2012 Operator’s Manual or Gas Tracer Operator’s Manual for problems you may encounter with the GX-2012 or Gas Tracer. Table 3: Troubleshooting the SDM-2012 Symptoms Probable Causes Recommended Action • Fresh air adjustment fails • The SDM-2012 is not in a fresh air environment or the cylinder being used is not a zero air cylinder. • If a zero air cylinder is used, the calibration cylinder is out of gas.
• No connection between instrument and PC Controller Program • SDM-2012 is not turned on. • The instrument is not correctly inserted into the instrument cradle. • The IR window is dirty. • The USB cable is not properly plugged into the SDM-2012 or the PC. 1. Turn on the SDM-2012. If it does not turn on, check that the AC adapter is plugged into an AC socket and to the jack on the back of the SDM-2012. 2. Check to make sure the instrument is inserted properly. 3. Clean the IR window on the SDM-2012. 4.
instrument(s) 20 seconds after a successful bump test or calibration or if there is no activity for the time period defined by Auto Power OFF Time in the Configuration Window. 3. Be sure that the AC adapter is plugged into a wall outlet, that the power jack is plugged into the back panel of the SDM-2012, and that the instrument is properly installed in the front recess of the instrument cradle. 4. While the instrument is on, the CHARGE LED will be blinking green.
Recharging a Battery Pack Without Performing Any Operations To recharge the batteries in an instrument without performing any other operations: 1. Confirm that the AC adapter is connected to the back panel of the SDM-2012 and to an AC wall socket. 2. Insert the instrument or battery pack into the front recess of the instrument cradle. Battery Pack CHARGE GX-2012 OFF POWER BUMP CAL. SDM-2012 EDIT ENTER COPY 1SEC ON 3SEC OFF Figure 90: Inserting the Battery Pack for Charging 3.
Battery Pack Too Drained for PC Controlled Operation If the Li-ion battery pack does not have enough power to keep the instrument on, it will go into a 5 minute charge cycle and the following screen will be displayed on the instrument screen. 04.59 CHARGING It will not connect to the docking station. The instrument cannot be bump tested or calibrated in the charge cycle. Once the 5 minute charge cycle has ended, the unit will automatically turn back on and connect to the docking station.
The lower left frame contains three selection boxes for organizing data. When viewing the data, it can be organized in two ways: 1. Base View Format If you do not select Serial No, Station ID, or User ID, the Base view box appears next to the selection boxes. The data can be organized by either data type or by the year and month of the saved data. Figure 91: Logs Window in Base View Format, Date To view data in the Date Base View Format: a. Select Date in the Base view box. b.
Figure 92: Logs Window in Base View Format, Type To view data in the Type Base View Format: a. Select Type in the Base view box. b. Click the expanded view symbol (+) next to a data type folder (Alarm, Calibration, etc.) in the Data frame of the Logs window or double click the folder to view the contents below it. c. Single click on a date folder. The dates are displayed in year/month format. All of the files in that date folder will appear in the upper right frame of the Logs window. d.
If any of these boxes are selected, the Base view box disappears. Click the selection box or boxes in the lower left frame to organize the data as desired. Figure 93: Logs Window in ID View Format To view data in the ID View Format: a. Select one or more of the ID view choices, Serial No., Station ID, or User ID. b. Click the expanded view symbol (+) next to an ID folder (Serial No., Station ID, or User ID) in the Data frame of the Logs window or double click the folder to view the contents below it. c.
the same year/month, they will be distinguished by their different serial numbers. NOTE: In the examples that follow, the data will be shown organized by serial number. If you do not select any of the organization boxes or select the Station ID or User ID boxes instead of or in addition to the Serial No. box, your Logs Window will look slightly different. Alarm Trend Data The instrument saves files that describe the most recent gas alarm events.
3. Click the year/month folder you wish to view. All alarm trend data files for that instrument in that particular year/month will appear in the upper right frame. The file number, serial number, station ID, user ID, model, date/time, and sample count of the alarm trend file appear in the same line.
4. Click a file to see the instrument information, gas readings at the time of the event, and the alarm setpoints in the lower right frame.
5. To view the alarm trend data, double click the desired file. Restore Layout Control Buttons Previous Figure 96: Alarm Trend Data Each data point will be displayed in the left half of the screen along with the peak readings (minimum for oxygen) over the previous 5 seconds. A graph of the data will appear on the right half of the screen. To change the layout of the table and chart in relation to each other, click any of the four layout control buttons in the upper left corner of the screen.
7. In the graph part of the screen, • You can choose which gas(es) you want to graph by selecting or deselecting the boxes next to each gas name. • To zoom in on a particular part of the graph, drag a box around that area so that it is highlighted in gray. The graph will zoom in. To return to a previous zoom, click the Previous control button in the upper right corner of the graph section. To return to the original zoom, click the Restore control button in the upper right corner of the graph section.
If List is selected, the file type is “.csv” (comma-separated values). If Graph is selected, the file type is “.bmp” (Windows bitmap). After specifying the file name and file location, click Save to save the file to the specified location. 10. To save the data to the clipboard, select either List or Graph in the upper right corner of the window and then click the Copy to Clipboard control button. The Copy to Clipboard control button has a clipboard icon on it.
3. Click the year/month folder you wish to view. All calibration data files for that instrument in that particular year/month will appear in the upper right frame. The file number, serial number, station ID, user ID, model, date/time, and result of the calibration appear in the same line. If calibrations were performed prior to connecting the instrument with the SDM-GX Docking Station PC Controller software, data for those calibrations will not appear until a complete download is performed.
4. Click one of the calibration data files. The fields in the bottom right frame will fill in. The instrument information will be displayed along with the calibration information. The tested sensors will be displayed along with the final gas concentration, the calibration gas values, and the result of the calibration. Figure 99: Viewing Calibration Data 5. Files that record a failed calibration on all channels are highlighted in red.
Calibration Report control button along the top of the Logs window. A dialog box will appear confirming if you want to print. Click OK. 10. To print detailed calibration and bump test data (if available) for each calibration and bump test file for a specific serial number, be sure that the desired serial number is selected in the upper left frame and click the Bump Test & Calibration Report control button along the top of the Logs window. A dialog box will appear confirming if you want to print. Click OK.
Alarm event files save the time, instrument channel, gas, and alarm type of every gas alarm event that occurs on a particular instrument. Warning (low alarm), Alarm (high alarm), STEL, TWA, and overscale events are saved. Trouble event files note the time, instrument channel, whether the event is an instrument system failure or sensor failure, and the specific type of failure. Calibration failures, dead battery alarms, and sensor failures are among the trouble events that are saved.
window. A “Save As” dialog box will appear for you to specify the file name and file location. Figure 102: Save As Dialog Box The file type will be a “.csv” (comma separated value). Specify the file name and location and click Save. 6. To copy event data from a date folder to the clipboard, be sure the desired date folder is selected and click the Save to Clipboard control button. The data will be saved to the clipboard. It can then be pasted into a document by using the Paste command in an application.
The data may be viewed in both table format and graph format if at least 5 scheduled data points have been logged at the programmed interval trend time. This does not include events. If an interval data file has fewer than five scheduled data points, the graph controls are not functional and the data is shown only in table format. Interval trend data will not appear unless a complete download is performed. To view and perform desired operations with the interval trend files: 1.
4. Click one of the interval trend data files. The fields in the bottom right frame will fill in. The instrument information will be displayed along with the average, minimum, and maximum gas readings for the operating session. Also displayed are the minimum date, the maximum date, and the warning, alarm, STEL, and TWA setpoints.
5. To view the interval trend data, double click the desired file. Layout Control Buttons Restore Previous Figure 105: Interval Trend Data In table format on the left half of the screen, the interval trend data is shown as the average gas readings over the user defined interval trend time. So if the data logging session started at 4:13:38 PM and the interval time is set to 1 minute, then the readings logged at 4:14:38 PM are the average reading for each channel over that one minute period.
To change the proportions of the table to the graph, click the divider between the two and move it. To display instrument information along with the data and graph, click the “i” control button in the upper left corner. 6. In the table part of the screen, • 7. 8. To view only events in the interval trend data file, click the Only Event selection box. In the graph part of the screen, • You can choose which gas(es) you want to graph by selecting or deselecting the boxes next to each gas name.
9. To save the data to a file which can be imported into another program, select either List or Graph in the upper right corner of the window and then click the Save to File control button. The Save to File control button has a floppy disk icon on it. A dialog box will appear for you to specify the file name, file location, and file type. Figure 106: Save As Dialog Box If List is selected, the file type is “.csv” (comma-separated values). If Graph is selected, the file type is “.bmp” (Windows bitmap).
expanded view symbol (+) of or double-click the serial number folder to view the contents. 2. Click the expanded view symbol (+) of or double-click the Memo folder to view the contents. Memo data folders are arranged by year/month. 3. Click the year/month folder you wish to view. All memo files for that instrument in that particular year/month will appear in the upper right frame.
4. Click on one of the memo files. The fields in the bottom right screen will fill in. The instrument information will be displayed along with the memo information. Figure 108: Viewing Memo File Data 5. To print memo data, click the Print control button in the upper left corner of the Logs window. A dialog box will appear confirming if you want to print. Click OK.
6. To save memo data, click the Save control button in the upper left corner of the Logs window. A “Save As” dialog box will appear for you to specify the file name and file location. Figure 109: Save As Dialog Box Specify the file name and location and click Save. 7. To copy memo data to the clipboard, click the Save to Clipboard control button. The data will be saved to the clipboard. It can then be pasted into a document by using the Paste command in an application.
3. Click the year/month folder you wish to view. All bump test data files for that instrument in that particular year/month will appear in the upper right frame. The file number, serial number, station ID, user ID, model, date/time of the bump test, and the results appear in the same line.
4. Click on one of the bump test data files. The fields in the bottom right frame will fill in. The instrument information will be displayed along with the bump test information. The tested sensors will be displayed along with the bump test gas reading, the bump test gas values, and the result of the bump test. Figure 111: Viewing Bump Test Data 5. Files that record a failed bump test on all channels are highlighted in red.
Report control button along the top of the Logs window. A dialog box will appear confirming if you want to print. Click OK. 10. To print detailed calibration (if available) and bump test data for each calibration and bump test file for a specific serial number, be sure that the desired serial number is selected in the upper left frame and click the Bump Test & Calibration Report control button along the top of the Logs window. A dialog box will appear confirming if you want to print. Click OK. 11.
2. Click the expanded view symbol (+) of or double-click the Barhole folder to view the contents. Barhole data folders are arranged by year/month. 3. Click the year/month folder you wish to view. All barhole files for that instrument in that particular year/month will appear in the upper right frame. The file number, serial number, station ID, user ID, model, and date/time appear in the same line.
4. Click on one of the barhole files. Each barhole file corresponds to a barhole test. The fields in the bottom right screen will fill in. The instrument information will be displayed along with the sampling time, average value, minimum value, maximum value, minimum date, maximum date, warning setting, and alarm setting for the combustible gas and oxygen channels. Figure 114: Viewing Barhole File Data 5.
6. To save barhole file information from a date folder (everything shown in the upper right frame), be sure that the desired date folder is selected and click the Save control button in the upper left corner of the Logs window. A “Save As” dialog box will appear for you to specify the file name and file location. Figure 115: Save As Dialog Box Specify the file name and location and click Save. 7.
3. Click the year/month folder you wish to view. One or more snap log files will appear in the top right frame. One snap log file is generated for all normal operation snap logs taken during an operating session. If you turn the instrument off and turn it back on, a new snap log file will be created. The file number, serial number, model, start date/time, and end date/time appear in the same line for each snap log data file.
4. Click on one of the normal operation snap log files. A summary will appear in the bottom right frame with instrument information. It will also show the gas readings that were saved for the first snap log in the snap log file.
5. To view the normal operation snap log data, double click the desired file. Figure 118: Normal Operation Snap Log Data File Opened The sampling period and instrument serial number will be displayed at the top of the screen. The file number, user ID, station ID, date/time, and channel readings will be displayed in one line for each snap log. Any channel events will appear below that channel’s reading. 6.
7. To save normal operation snap log data, click the Save control button in the upper right corner of the window. A “Save As” dialog box will appear for you to specify the file name and file location. Figure 119: Save As Dialog Box Specify the file name and location and click Save. 8. To copy normal operation snap log data to the clipboard, click the Save to Clipboard control button. The data will be saved to the clipboard.
3. Click the year/month folder you wish to view. One or more snap log files will appear in the top right frame. One snap log file is generated for all leak check snap logs taken during an operating session. If you turn the instrument off and turn it back on, a new snap log file will be created. The file number, serial number, model, start date/time, and end date/time appear in the same line for each snap log file. The start date/time correspond to the date and time that the instrument was turned on.
4. NOTE: Click on one of the leak check snap log files. The fields in the bottom right screen will fill in. The instrument information will be displayed along with the recorded Base gas concentration for the first snap log. One complete leak check snap log consists of a Base reading and a Peak reading. Simply selecting a leak check snap log file does not allow you to view the complete data for a leak check snap log.
5. To view the complete leak check snap log data, double click the desired file. Figure 122: Leak Check Snap Log Data File Opened Each leak check snap log consists of a Base reading and a Peak reading. Base readings are shown in yellow and Peak readings are shown in white. The file number, user ID, station ID, type of reading, date/time, and methane reading are shown. The methane reading is based on a 5000 ppm scale. It does not matter what the display range was set to when the gas reading was taken.
7. To save leak check snap log data, click the Save control button in the upper right corner of the window. A “Save As” dialog box will appear for you to specify the file name and file location. Figure 123: Save As Dialog Box Specify the file name and location and click Save. 8. To copy leak check snap log data to the clipboard, click the Save to Clipboard control button. The data will be saved to the clipboard. It can then be pasted into a document by using the Paste command in an application.
Deleting Data in the Logs Window Data can be deleted from the Logs window by right clicking on the folder or file you wish to delete. Any file or folder except for Memo data may be deleted. Figure 124: Deleting Data in the Logs Window 1. Right click on the folder or file you wish to delete and click Delete. 2. You will be prompted for a password. The factory set password is ABCDE. It is case sensitive. After you have entered the password, click OK. 3.
Instrument Function Menu When you are in the main program window, if you right click on an instrument or a docking station, the Instrument Function Menu appears. Figure 125: Instrument Function Menu The functions in the Instrument Function Menu are Open, Edit, Download, Clear Logs, and Power Off. Edit is only selectable if the Change Parameter selection box in the Parameter Tab of the Configuration Window is selected.
Sensor Tab, and the Station & User Tab. For further explanation of each tab, see the next section. Figure 126: Instrument Information Window, Parameter Tab To exit the Instrument Information Window and return to the main program window, click Cancel. Edit Function This function can be activated by either right clicking an instrument and selecting Edit(E) when the pull down menu appears or by selecting an instrument and then using the alt/E key combination.
NOTE: The following parameters are instrument parameters, not PC Controller Program parameters, and with the exception of Calibration Interval and Cal Check Gas, do not affect the operation of the PC Controller Program. Since the PC Controller Program uses the Calibration Interval and Cal Check Gas settings retrieved from the instrument to determine if a calibration is due, changing these settings will affect the program’s operation.
• User ID: To change the user ID, select the drop-down menu and select the desired station ID. To change the user ID list, see “Station & User Tab” on page 167. • Cal Interval (Day): The calibration interval is the length of time between scheduled calibrations. To change the calibration interval, use the arrows to the right of the current value to increase or decrease the interval. You may also highlight the current setting and type in the new desired setting.
Option 1 Sub Tab Figure 128: Parameter Tab, Option 1 The adjustable instrument parameters in the Option 1 Tab are: • OXY Alarm Pattern: The oxygen alarms can be set to Falling and Rising, Both Alarms Falling, or Both Alarms Rising. If set to Falling and Rising (factory setting), the first oxygen alarm will be a decreasing alarm and the second oxygen alarm will be an increasing alarm. If set to Both Alarms Falling, both oxygen alarms will be decreasing alarms.
calibration dates for only the standard 4 sensors (LEL, O2, H2S, and CO) are used to determine if calibration is due. If Cal Check Gas is set to ALL, the calibration date for the standard 4 sensors along with the %volume sensor and ppm sensor (Gas Tracer only) are used to determine if a calibration is due. • Alarm Latching: With alarm latching selected (factory setting), the instrument remains in alarm condition until the alarm condition passes and the POWER ENTER button is pressed.
selected, the Data Logging Screen only shows the remaining log time and does not give you the opportunity to clear the logged data. • Zero Adjustment On Demand: If Zero Adjustment On Demand is selected (factory setting), the user may perform a fresh air adjustment in normal operation by pressing the AIRS button. If Zero Adjustment On Demand is not selected, a fresh air adjustment cannot be performed using the AIRS button in normal operation.
Option 2 Sub Tab The Option 2 Tab of the Parameter Tab contains additional instrument parameters that can be changed. Figure 129: Parameter Tab, Option 2 • HC Pattern: The HC Pattern setting allows the user to select the units for the combustible gas channel. If you have a standard 4 sensor instrument, this setting must be set to %LEL ONLY. If you have a standard 4 sensor plus %volume sensor instrument, you can set the HC Pattern to AUTO or to vol% ONLY.
Manual for a description of the operational modes. • BH Measuring Time: The BH Measuring Time parameter only applies to instruments being used in Bar Hole Mode. The BH Measuring Time is the amount of time the unit samples the bar hole. It can be set to 30 (factory setting), 45, or 60 seconds. Use the up and down arrow buttons to make your selection.
Option 3 Sub Tab Figure 130: Parameter Tab, Option 3 • Bump Test Function: The Bump Test Function setting is used to turn the bump test function on or off. If deselected (factory setting), the BUMP menu item in Calibration Mode and Maintenance Mode does not appear. In addition, the BUMP--SET, BP INTVL, BP RMNDR, and BP EXPRD menu items will not appear in Maintenance Mode.
• Bump Test Past Due Act: The Bump Test Past Due Act determines how the instrument will react to a needed bump test during the start up sequence. If Bump Test Past Due Act is set to Confirm to Bump Test (factory setting), the instrument will sound an alarm and the user will have to press and release the POWER ENTER button to continue. If set to Must Bump Test, the instrument cannot be used until a bump test has been performed.
Sensor Tab The Sensor Tab displays the alarm settings and auto calibration values for all installed sensors. It also shows the date and time of the most recent calibration for each channel. If you are viewing a standard 4-gas GX-2012 plus a %volume sensor, the information for the %volume sensor will appear directly below the H2S sensor’s information.
Figure 132: Sensor Tab %Volume Gas Tracer Any value in a white box can be changed. Values in shaded boxes cannot be changed. To change a value: 1. Click the box whose value you want to change. The entire box will turn blue. 2. Click the box again and only the value will be highlighted in blue. 3. Type in the new desired value. 4. Repeat steps 1 through 3 for any other values you wish to change and then click OK. 5. You will be asked if you want to save the changes that you made.
Station & User Tab The Station & User Tab allows you to update the Station ID and User ID lists in a connected instrument. To edit the Station ID or User ID list, you will need to import a csv (comma separated values) file into the program. A Station csv file and a User csv file are provided with the SDM-2012 product CD. In addition, you can generate csv files for editing from the PC Controller Program. Creating ID Files 1.
2. Navigate to the location you want to save the file, type in a file name, and click Save. You can save multiple station and user ID files if desired.
3. The csv files can be opened, edited, and saved using a word processing program such as Word, WordPad, or Notepad. The Station and User csv files consist of the Station or User ID number and its associated name. Below is an example of the Station csv file opened in WordPad. Figure 135: Station ID CSV File Opened in WordPad Any existing Station or User IDs will be displayed. Undefined Station or User IDs will appear as dashes.
Loading ID Files 1. In the Station & User Tab, click Import csv file for either the Station ID list or User ID list.
2. Navigate to the file you wish to import and click Open. Figure 137: Open Station ID CSV File 3. Once you have imported the Station ID and/or User ID csv files, the new list will be reflected in the Station & User Tab.
4. Click OK to save the changes and click Yes in the confirmation window that comes up. The program will tell you to wait while it updates the instrument. To exit this screen without saving changes, click Cancel. 5. To select a Station ID or User ID for the instrument, go back to the Parameter tab. See “Parameter Tab” on page 155 for instructions to select a station ID or user ID. 6. To exit the Station & User Tab, click the OK button in the lower right corner of the window.
Config Window To enter the Configuration Window, click the Config button. The program will prompt you for a password. The default password is ABCDE. Enter the password and click OK keeping in mind that the password is case sensitive. The password can be changed once you enter the Configuration Window. The Parameter Tab of the Configuration Window will be displayed. Parameter Tab See “Setting Up the Configuration” on page 32 for a description of the Parameter tab.
3. A window will appear telling you to restart the PC Controller Program. Click OK. 4. Click OK in the Database Tab. 5. Click the Exit control button in the upper right corner of the main program window. 6. Reopen the PC Controller Program. To create a new database: 1. Click the Create button located along the left side of the Database Tab window. 2. Choose where you would like the new database to be stored and enter a name for it and click Save.
Password Tab The password Tab allows you to change the Configuration Window password to something other than the factory set ABCDE. It can be up to 12 characters long and contain any letter, number, or symbol. It is case sensitive. Figure 140: Config Window Password Tab To change the password: 1. Enter the new password in the top box and confirm it in the bottom. Click OK. A window will pop up asking you to confirm the change. • To confirm, click Yes.
2. To cancel any changes you have made at any time, click Cancel in the main Password Tab. The program will tell you that changes will not be saved. To continue to exit, click OK. To return to the Password Tab, click Cancel.
Table 4: Spare Parts List Part Number Description 81-0012RK-03 Calibration cylinder, 50 %LEL CH4 in air, 103 liter steel 81-0016RK-05 Calibration cylinder, 100% vol CH4 in N2, 58 liter steel 81-0018RK-01 Calibration cylinder, 50 %LEL isobutane in air, 34 liter steel 81-0018RK-03 Calibration cylinder, 50 %LEL isobutane in air, 103 liter steel 81-0026RK-01 Calibration cylinder, 250 ppm isobutane in air, 34 liter 81-0026RK-03 Calibration cylinder, 250 ppm isobutane in air, 103 liter 81-0076RK Ze
Appendix A: Multiple Instrument Configurations RKI Instruments, Inc. recommends bump testing and calibrating GX-2012s and Gas Tracers separately. If desired or needed, however, GX-2012s and Gas Tracers can be bump tested and calibrated at the same time using the PC Controller Program. If you are going to test the instruments together, do not manifold the different types of instruments together.
the Configuration” on page 32 for instructions. 3. NOTE: 4. Verify that the appropriate calibration gas cylinder(s) are connected to the appropriate SDM-2012(s) or manifold line(s). The ppm sensor will be bump tested first. Be sure that a 6 inch humidifier tube is used to connect the ppm calibration cylinder to the GAS 2 fitting on the back of any SDM-2012(s) with Gas Tracers installed.
5. Select the instruments you wish to bump test and click on them to highlight them as shown below. To select multiple instruments for bump testing, hold down the Control button on the keyboard as you click them. Figure 141: Instrument Selection 6. If you would like an automatic calibration to occur after a failed bump test, select the Force Calibration selection box. 7. Click the Bump test button in the lower right corner of the main program window.
8. You will be asked to confirm which instrument channels will use GAS 1 for the bump test. The gas concentration shown next to each channel is the auto calibration value for that channel. If it does not match the gas concentration in the cylinder(s), change the auto calibration value for that channel. See “Sensor Tab” on page 165 for instructions. If you are bump testing standard GX-2012s and standard Gas Tracers, leave the first channel (the ppm sensor) deselected and select all other channels.
If you are bump testing a 0 - 10000 ppm range Gas Tracer, the Gas Cylinder Confirmation Screen will appear as shown below. Even though there are no other sensors installed in the instrument, GAS 2 will still be used to bump test the ppm sensor. The ppm sensor will be deselected in this screen and cannot be selected. Figure 143: Gas Cylinder Confirmation Screen, 0 - 10000 ppm Gas Tracer When all of the desired channels are selected, click OK.
the ppm combustible sensor, leave the GAS 2 box deselected. The SDM-2012 will bump test the ppm sensor using the Gas Tracer’s WET setting for the fresh air adjustment and the span adjustment. This is not user adjustable using the PC Controller Program. If the SDM-2012 is not in a fresh air environment, a zero air cylinder must be used with a 6 inch humidifier tube connecting the cylinder to the AIR fitting.
If you are bump testing any instruments that include a %volume sensor, the screen will appear as shown below and will indicate a gas cylinder change is needed. The ppm sensor will be bump tested first with GAS 2. The standard sensors will then be bump tested using GAS 1. The %volume sensor will then be bump tested with GAS 2. The user must change the GAS 2 cylinder before the %volume sensor can be bump tested. The GAS 2 selection boxes are deselected by default.
If you are bump testing a 0 - 10000 ppm Gas Tracer, the screen will appear as shown below. The ppm sensor will be bump tested using GAS 2. The GAS 2 selection box is deselected by default. You must select the GAS 2 box to bump test the ppm combustible sensor. If you do not select the GAS 2 box, the bump test will not continue. Be sure that the ppm calibration cylinder is connected to the GAS 2 fitting with a 6 inch humidifier at the start of the bump test.
11. If a bump test or calibration has already been performed by the PC Controller program on a GX-2012 or a Gas Tracer with a %volume sensor installed, the docking station will perform a purge before beginning the bump test. The purge ensures that any %volume calibration gas does not come in contact with the ppm sensor and affect its readings. The screen will indicate that you need to remove the gas cylinder from the GAS 2 fitting on the back of the SDM2012.
15. The pumps will start and the program will indicate that air is flowing. The AIR indicator on the program screen will be on. The BUMP T LED on the SDM2012 control panel will be flashing amber. Air will be applied to the ppm sensor for 45 seconds, then the PC Controller Program will perform a zero adjustment on the ppm channel. If at any point during the bump test you wish to cancel the bump test, click the Cancel button in the lower right corner of the screen.
16. After air is applied, and if the ppm sensor passed the zero adjustment, calibration gas from the GAS 2 cylinder will be applied to the ppm sensor. The GAS 2 indicator on the program screen will come on and calibration gas will be applied to the ppm sensor for the duration specified in the Gas Exposure Time parameter in the Configuration Window. Figure 148: GAS 2 PPM Gas Flowing The PC Controller program will analyze the results.
17. After calibration gas has been applied to the ppm sensor, fresh air will be applied to the standard sensors (catalytic LEL, O2, H2S (GX-2012 only), and CO) and the %volume sensor (if installed) for 45 seconds and the PC Controller program will perform a zero adjustment. Figure 149: Air Flowing to Standard Sensors The PC Controller Program will analyze the zero adjustment results.
18. After air is applied, and if all standard channels and the %volume channel (if installed) passed the zero adjustment, calibration gas from the GAS 1 cylinder will be applied. The GAS 1 indicator on the program screen will come on and calibration gas will be applied to the instrument(s) for the duration specified in the Gas Exposure Time parameter in the Configuration Window. Figure 150: GAS 1 Flowing The PC Controller Program will analyze the results.
19. If you are not bump testing an instrument or instruments with a %volume sensor installed, continue to step 22. If you are bump testing an instrument or instruments with a %volume sensor installed, you will be prompted to change the GAS 2 cylinder. The pump(s) on the instrument(s) will stop. 20. Change the cylinder connected to the GAS 2 fitting to the %volume calibration cylinder. 21. When you have changed the GAS 2 cylinder, click OK.
calibration will automatically begin on the %volume sensors for those instruments and GAS 2 calibration gas will continue to flow. 22. After GAS 2 calibration gas has been applied, the docking station will purge with fresh air for 45 seconds.
23. After the fresh air purge is complete, • If the bump test passes, the following window will open indicating that. The BUMP T LED will be solid green. Click OK to return to the main program window. The BUMP T LED will turn off. Figure 153: Bump Test Passed The instrument will automatically be shut off 20 seconds after a successful bump test.
• If the bump test fails and the Force Calibration box was not selected, the following window will open indicating which channels failed the bump test. The BUMP T LED on the SDM-2012 control panel will be solid red. Click OK to return to the main program window or double click the instrument information line to view the bump test results in the Logs window. The BUMP T LED on the SDM-2012 control panel will turn off.
• If the bump test fails and the Force Calibration box was selected, the SDM-2012 automatically performs a calibration immediately after the failed bump test. The results screen will indicate the results of both the bump test and calibration. The BUMP T LED on the SDM-2012 control panel will be solid red. The CAL S LED will be solid green if the calibration passed or solid red if the calibration failed.
• If at any point during the bump test the flow rate to the instrument becomes too low, the PC Controller Program will abort the bump test and display a failed bump test screen. The BUMP T LED on the SDM-2012 control panel will be solid red. Click OK to return to the main program window or double click an instrument information line to view the bump test or calibration results in the Logs window. The BUMP T LED on the SDM2012 control panel will turn off.
Calibrating GX-2012s and Gas Tracers The following instructions apply to standard GX-2012s that contain the standard sensors (catalytic LEL, O2, H2S, and CO) as well as standard Gas Tracers that contain the standard sensors (catalytic LEL, ppm combustible, O2, and CO). They also apply to GX-2012s and Gas Tracers that have a %volume combustible gas sensor installed.
4. Ensure that the gas out to instrument line is connected to the inlet of each instrument and that the exhaust line is connected to the exhaust fitting of each instrument. 5. Select the instruments you wish to calibrate and click on them to highlight them as shown below. To select multiple instruments for calibration, hold down the Control button on the keyboard as you click them. Figure 157: Instrument Selection 6. Click the Calibration button in the lower right corner of the computer program screen.
7. You will be asked to confirm which instrument channels will use GAS 1 for the calibration. The gas concentration shown next to each channel is the auto calibration value for that channel. If it does not match the gas concentration in the cylinder(s), change the auto calibration value for that channel. See “Sensor Tab” on page 165 for instructions. If you are calibrating standard GX-2012s and standard Gas Tracers, leave the first channel (the ppm sensor) deselected and select all other channels.
If you are calibrating a 0 - 10000 ppm range Gas Tracer, the Gas Cylinder Confirmation Screen will appear as shown below. Even though there are no other sensors installed in the instrument, GAS 2 will still be used to calibrate the ppm sensor. The ppm sensor will be deselected in this screen and cannot be selected. Figure 159: Gas Cylinder Confirmation Screen, 0 - 10000 ppm Gas Tracer When all of the desired channels are selected, click OK.
combustible sensor, leave the GAS 2 box deselected. The SDM-2012 will calibrate the ppm sensor using the Gas Tracer’s WET setting for the fresh air adjustment and the span adjustment. This is not user adjustable using the PC Controller Program. If the SDM-2012 is not in a fresh air environment, a zero air cylinder must be used with a 6 inch humidifier tube connecting the cylinder to the AIR fitting.
If you are calibrating any instruments that include a %volume sensor, the screen will appear as shown below and will indicate a gas cylinder change is needed. The ppm sensor will be calibrated first with GAS 2. The standard 3 sensors will then be calibrated using GAS 1. The %volume sensor will then be calibrated with GAS 2. The user must change the GAS 2 cylinder before the %volume sensor can be calibrated. The GAS 2 selection boxes are deselected by default.
If you are calibrating a 0 - 10000 ppm Gas Tracer, the screen will appear as shown below. The ppm sensor will be calibrated using GAS 2. The GAS 2 selection box is deselected by default. You must select the GAS 2 box to bump test the ppm combustible sensor. If you do not select the GAS 2 box, the bump test will not continue. Be sure that the ppm calibration cylinder is connected to the GAS 2 fitting with a 6 inch humidifier at the start of the calibration.
10. If a bump test or calibration has already been performed by the PC Controller program on a GX-2012 or a Gas Tracer with a %volume sensor installed, the docking station will perform a purge before beginning the calibration. The purge ensures that any %volume calibration gas does not come in contact with the ppm sensor and affect its readings. The screen will indicate that you need to remove the gas cylinder from the GAS 2 fitting on the back of the SDM2012.
14. The pumps will start and the program will indicate that air is flowing. The AIR indicator on the program screen will be on. The CAL S LED on the SDM-2012 control panel will begin to flash amber. Air will be applied to the ppm sensor for 45 seconds, then the PC Controller Program will perform a zero adjustment on the ppm sensor. If at any point during the calibration you wish to cancel the calibration, click the Cancel button in the lower right corner of the screen.
15. After air is applied, and if the ppm sensor passed the zero adjustment, calibration gas from the GAS 2 cylinder will be applied to the ppm sensor. The GAS 2 indicator on the program screen will come on and calibration gas will be applied to the ppm sensor for 90 seconds. Figure 164: GAS 2 PPM Gas Flowing The PC Controller program will analyze the results.
16. After calibration gas has been applied to the ppm sensor, fresh air will be applied to the standard sensors (catalytic LEL, O2, H2S (GX-2012 only) and CO) and the %volume sensor (if installed) for 45 seconds and the PC Controller program will perform a zero adjustment. Figure 165: Air Flowing to Standard Sensors The PC Controller Program will analyze the zero adjustment results.
17. After air is applied, and if all standard channels and the %volume channel (if installed) passed the zero adjustment, calibration gas from the GAS 1 cylinder will be applied. The GAS 1 indicator on the program screen will come on. GAS 1 calibration gas will be applied to the instrument(s) for 90 seconds. Figure 166: GAS 1 Flowing The PC Controller Program will analyze the results. 18. If you are not calibrating an instrument or instruments with a %volume sensor installed, continue to step 22.
20. When you have changed the GAS 2 cylinder, click OK. The calibration will continue and the second GAS 2 calibration gas will be applied to the %volume sensor for 90 seconds.
21. The PC Controller Program will analyze the results. 22. After calibration gas is applied, the docking stations will purge with fresh air for 45 seconds.
23. After the fresh air purge is complete, • If the calibration passes, the following window will open indicating that. The CAL S LED on the SDM-2012 control panel will be solid green. Click OK to return to the main program window. The CAL S LED will turn off. Figure 169: Calibration Passed The instrument will automatically be shut off 20 seconds after a successful calibration.
• If the calibration fails, the following window will open indicating which channels failed to calibrate. The CAL S LED on the SDM-2012 control panel will be solid red. Click OK to return to the main program window or double click the instrument information line to view the calibration results in the Logs window. The CAL S LED on the SDM-2012 control panel will turn off.
• If at any point during the calibration the flow rate to the instrument becomes too low, the PC Controller Program will abort the calibration and display a failed calibration screen. The CAL S LED on the SDM-2012 control panel will be solid red. Click OK to return to the main program window or double click the instrument information line to view the calibration results in the Logs window. The CAL S LED on the SDM-2012 control panel will turn off.