
User Manual


84 • Set Window
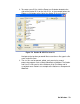
4. Select the colors used to graph the various target gases in the interval
trend and alarm trend data files by clicking the appropriate Graph
Color button on the left side of the Set Window in the Font and Color
frame.
• The Color Window shown on the left above appears when the
Graph Color button is clicked.
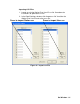
• If you want to define a custom color, click the Define Custom
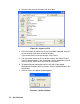
Figure 85: Font Window
Figure 86: Color and Custom Color Windows