
User Manual


56 • Viewing, Printing, Exporting, & Deleting Data in the Data Window
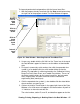
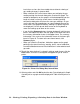
7. Alarm trend data can be viewed in either table or graph format by
selecting the Table or Graph selection buttons. The example below in
Figure 51 is in table format.
• In table format, the log times are shown along with the peak
(minimum for oxygen) gas readings for the previous five seconds.
• The gas readings at the time of the alarm event around which the
logged data are centered are highlighted in red and are the
instantaneous readings at that time.
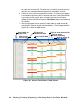
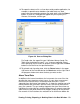
• If you click the Summary button, the data window will split into two
frames, one above the other, with the data table in the lower frame
and the summary information shown in the upper frame. The
summary information is the same as the information shown in the
lower right frame in Figure 50.
Alarm Event
Figure 51: Alarm Trend Data in Table Format
Click to print data
Click to save data to a file
Click for a summary
of the data
Select table or
graph view