
User Manual


Viewing, Printing, Exporting, & Deleting Data in the Data Window • 53
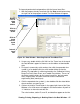
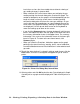
14.To export the data to a file so it can be used by another application, for
example a spreadsheet or database (for table data) or a word
processing or presentation program (for graph data), click the Export
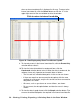
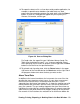
button. A “Save As” dialog box will appear for you to specify the
filename, file location, and file type.
For Graph view, the export file type is Windows bitmap (.bmp). For
Table view, the default file type is “.csv” (comma-separated values).
After specifying the file name, file location, and file type click the Save
button to save the file to the specified location.
15.To go back and view other data, click the Return button in the upper
right corner of the Data Window or the Data button on the right side of
the program window and select the data you want to view.
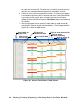
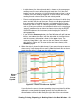
Alarm Trend Data
In addition to the interval trend data, the instrument also saves files that
describe the most recent gas alarm events. If a gas alarm event occurs,
then an alarm trend file that is centered around the event is saved
separately from the interval trend data files. It shows the readings up to 30
minutes before and 30 minutes after the event, with the log interval time
every five seconds. The gas readings logged at the alarm event time are
highlighted in red and the gas readings logged every 5 seconds around the
alarm event are the peak (minimum for oxygen) readings for the previous
five seconds. If the instrument has not been on for 30 minutes before the
Figure 49: Save as Dialog Box