
User Manual


52 • Viewing, Printing, Exporting, & Deleting Data in the Data Window
levels than sessions that show stable data to allow for viewing of
gas reading changes in greater detail.
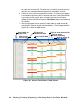
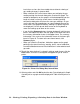
• When selected, the Cursor feature allows you to display the gas
reading and log time for each data point saved on the graph. The
number of data points on the graph is minimized depending on the
length of a data session by several means including omitting
consecutive data points that have the same gas readings. As you
use the left and right arrow buttons on your keyboard to move the
cursor across the graph horizontally, readings at specific log times
are displayed. Use the up and down arrows on the keyboard to
move the readings up or down on the screen.
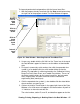
• If you click the Summary button, the data window will split into two
frames, one above the other, with the graph in the lower frame and
the summary information shown in the upper frame. The summary
information is the same as the information shown in the lower right
frame in Figure 43. To return to the one frame format, click
Summary again.
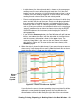
• When you select the Event box, indications appear on the graph
pointing to the exact time that a warning, alarm, start of calibration,
or end of calibration occurred. Each indication is color coded to each
gas color.
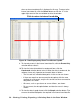
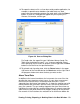
12.To print the data, whether it is viewed in table or graph format, click the
Print button. A Printer List dialog box will appear for you to select a
printer.
13.Select a printer and click OK to print the data. Data displayed in Graph
view will print as a graph and data displayed in Table view will print as a
table.
Figure 48: Printer List Dialog Box, Interval Data