
User Manual


Viewing, Printing, Exporting, & Deleting Data in the Data Window • 49
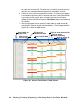
• In table format, the interval trend data is shown as the average gas
readings over the user defined interval trend time. So if the data
logging session started at 4:13:38 PM and the interval time is set to
1 minute, then the readings logged at 4:14:38 PM are the average
reading for each channel over that one minute period.
• Events are displayed on the screen under the channel in which they
occur and with the time of the event. Events are displayed whether
they occurred at scheduled log times or in between them. Events
include gas alarms such as a warning condition, trouble conditions
such as a low sensor failure, an indication that the unit is returning to
“normal” condition after an alarm has been reset using the RESET
SILENCE button on the instrument, and changing the station ID
during operation.
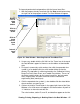
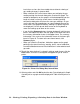
• If you click the Summary button, the Data Window will split into two
frames, one above the other, with the data table in the lower frame
and the summary information shown in the upper frame. The
summary information is the same as the one shown in the lower
right frame in Figure 43. To return to the one frame format, click
Summary again.
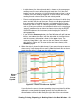
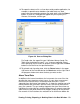
8. When the data is viewed in table format, if you move the cursor over an
alarm event, it will change into a small symbol that looks like an alarm
trend data file while it is kept over the alarm event.
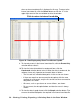
If you click on the event, the corresponding alarm trend data file will be
opened in a new window that pops up over the Data Window. No
control buttons will be visible along the right side of the new window
Figure 45: Alarm Trend Cursor Symbol
Alarm
Cursor
Symbol
Trend