
User Manual


44 • Viewing, Printing, Exporting, & Deleting Data in the Data Window
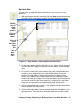
check snap logs taken during an operating session. If you turn the
instrument off and turn it back on, a new snap log file will be created.
The serial number, start date/time, and end date/time appear on the
line for each snap log data file. The start date/time corresponds to the
date and time that the instrument was turned on. The end date/time
corresponds to the date and time that the instrument was turned off.
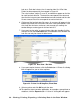
6. Click one of the snap log data file names. A summary will appear in the
bottom right frame with instrument information. It will also show the gas
reading that was saved for the first snap log Base reading in that snap
log file.
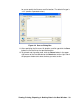
7. If you want to view, print, or export the snap log data, double-click the
filename or click the View Data button at the bottom of the window.
Snap log files can only be viewed in table format.
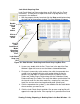
Each leak check snap log consists of a Base reading and a Peak
reading. Base readings are shown in yellow and Peak readings are
shown in white. The User ID, Station ID, date/time, and methane
reading are shown. The methane reading is based on a 5000 ppm
scale. It does not matter what the display range was set to when the
gas reading was taken. The actual gas reading will be displayed up to
5000 ppm. If the concentration was over 5000 ppm, OVER will replace
the gas reading. If the Gas Tracer’s CO Display in Leak Check Mode
setting was turned on for operation, the CO reading will not be shown
in this screen because it is not saved.
Figure 40: Data View - Leak Check Snap Log