
User Manual


34 • Viewing, Printing, Exporting, & Deleting Data in the Data Window
data.
3. Find your instrument by serial number, then click the expanded view
symbol (+) of or double-click the serial number folder to view the
contents.The top folder is untitled and contains the Alarm Events
Folder and Trouble Events Folder along with the Calibration History
Folder and Bump Test Folder. The rest of the folders contain folders for
the interval trend files, bar hole mode files, snap log files, and alarm
trend files and are named and organized by date (month/year).
4. Click the expanded view symbol (+) of or double-click the untitled
folder. The Alarm Events Folder and Trouble Events Folder will appear
below the untitled folder along with the Calibration History Folder and
Bump Test Folder.
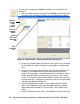
5. Click the Alarm Events or Trouble Events folder. One or more alarm or
trouble event files will appear in the top right frame. An Alarm Events
Folder has been opened in the example in Figure 26. If multiple user
IDs or Station IDs are used for an instrument, then more than one
event file will appear.
The serial number, station ID, user ID, and date/time appear on the line
for each alarm event or trouble event file. The date/time correspond to
the date and time that the instrument was downloaded and not the date
and time of an alarm or trouble event.
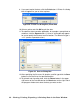
6. Click the desired event file to select it. An event list will appear in the
bottom right frame with the date, time, channel, and event type for the
first eight events saved in the selected file. If more than eight events
are saved, the first eight events are shown and the total number of
events in the file is shown at the bottom of the list.