GX-2012 Data Logger Management Program Operator’s Manual Part Number: 71-0245RK Revision: 0 Released: 7/17/13 www.rkiinstruments.
Warranty RKI Instruments, Inc. warrants gas alarm equipment sold by us to be free from defects in materials and workmanship, and performance for a period of one year from date of shipment from RKI Instruments, Inc. Any parts found defective within that period will be repaired or replaced, at our option, free of charge.
Table of Contents Introduction . . . . . . . . . . . . . . . . . . . . . . . . . . . . . . . . . . . . . . . . . . . . . . . . . . . . . . . . . . 1 System Requirements . . . . . . . . . . . . . . . . . . . . . . . . . . . . . . . . . . . . . . . . . . . . . . . . . 3 Installing the GX-2012 Data Logger Management Program. . . . . . . . . . . . . . . . . . . . 3 IrDA Downloading Cable . . . . . . . . . . . . . . . . . . . . . . . . . . . . . . . . . . . . . . . . . . . . . . .
Last Calibration Window . . . . . . . . . . . . . . . . . . . . . . . . . . . . . . . . . . . . . . . . . . . . . . . 64 Effects of BUMP DSP Parameter Setting on Appearance of Last Calibration Window . . . . . . . . . . . . . . . . . . . . . . . . . . . . . . . . . . . . . . . . . . . . . . . 64 Viewing & Printing Last Calibration Data . . . . . . . . . . . . . . . . . . . . . . . . . . . . . . 66 Need Calibration/Need Bump Test View Option . . . . . . . . . . . . . . . . . . . . .
Introduction Using an advanced detection system consisting of up to five gas sensors, the GX-2012 and Gas Tracer Personal Gas Monitors detect the presence of combustible gases, oxygen (O2), carbon monoxide (CO), and hydrogen sulfide (H2S, GX-2012 only) simultaneously. The compact size and easyto-use design make them ideally suited for a wide range of applications as described in the GX-2012 Operator’s Manual and in the Gas Tracer Operator’s Manual.
CAUTION: The GX-2012 and Gas Tracer units detects oxygen deficiency and elevated levels of oxygen, combustible gases, carbon monoxide, and hydrogen sulfide, all of which can be dangerous or life threatening. When using the GX-2012 or Gas Tracer, you must follow the instructions and warnings in the GX-2012 Operator’s Manual or Gas Tracer Operator’s Manual to assure proper and safe operation of the unit and to minimize the risk of personal injury.
System Requirements To use the GX-2012 Data Logger Management Program, your personal computer must meet the following requirements: • Operating Systems: Windows® XP, Windows® Vista, or Windows® 7 • Processor: IBM® compatible PC running Pentium® 2 or higher. • Memory: 32 MB RAM minimum • Available Hard Disk Space: 32 MB minimum • CD-ROM Drive • Infrared port or USB port and a USB/IrDA adapter cable Installing the GX-2012 Data Logger Management Program 1. Launch Windows®. 2.
4. After a few seconds, a screen appears indicating that the InstallShield Wizard is preparing to install the Data Logger Management Program, then the GX-2012 InstallShield Wizard window appears to guide you through installation. Figure 1: GX-2012 Data Logger Management Installation Program 5. Follow the on-screen instructions in the InstallShield Wizard Window to install the program. 6.
IrDA Downloading Cable The instrument communicates with a computer via an on-board infrared communication port that complies with IrDA protocol standards. NOTE: If your computer has a built-in infrared port, you do not need an adapter cable to download data. If your computer does not have an infrared port, you will need to install an IrDA/USB adapter cable on your computer to use the GX-2012 Data Logger Management Program with your instrument. The IrDA/USB cable is available from RKI Instruments, Inc.
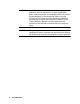
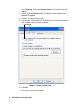
select Settings, then select Control Panel. The Control Panel will appear. 3. Double click on Wireless Link. The Wireless Link Configuration Window will appear. 4. Click on the Image Transfer tab. 5. Deselect the selection box for “Use Wireless Link to transfer images from a digital camera to your computer.” Deselect Figure 2: Image Transfer Tab 6. Click OK. 7. Close the Control Panel window.
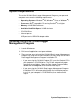
Launching the Program 1. Click Start on the Windows® Icon Tray, then select All Programs, then select GX-2012. Your operating system may also have a shortcut installed in the Start menu. 2. The program will launch and the Download window will appear. For more convenient viewing, the window can be enlarged by clicking and dragging the edges. Figure 3: The Download Window 3. For convenience, make a shortcut of the GX-2012 Data Logger Management Program and place it on the Windows® desktop.
Control Buttons This section provides an overview of the control buttons. Instructions for using the various parts of the program accessed by the control buttons are given in other parts of this manual. When the program is launched, it opens in the Download Window. Along the right side of the Download Window are six control buttons that access other windows in the program.The figure below shows the various windows that you can access when you click the control buttons.
Download Button If you are in another program window, clicking the Download button opens the Download Window (see Figure 3). The Download window has several download commands that allow you to perform various data retrieval functions with an instrument that is connected to the software. Data can be retrieved from the instrument, data can be cleared from the instrument, and the instrument can be turned off.
Data Button Clicking the Data button opens the Data Window. Figure 6: Data Window In the Data Window, you can view, print, export, and delete data that has been downloaded from instruments. NOTE: If the GX-2012 Data Logger Management Program database is on the user’s computer (default setting), data will only appear for instruments downloaded to that computer. If the database is on a network, data will appear for all instruments downloaded to that database.
• Calibration History Files A calibration history file is saved for each instrument that has been downloaded. It records the calibration information for every calibration that was downloaded. The instrument can save information for up to 124 bump tests and calibrations in its memory. • Alarm Event Files Alarm event files record gas alarm events that have been downloaded from instruments. The instrument can save up to 124 alarm events in its memory.
Last Calibration Button Clicking the Last Calibration button opens the Last Calibration Window. NOTE: The setting of the BUMP DSP instrument parameter affects whether the Bump Test portion of the Last Calibration Window is shown. For further explanation of the BUMP DSP parameter as it pertains to the Last Calibration Window, see “Effects of BUMP DSP Parameter Setting on Appearance of Last Calibration Window” on page 64.
Set Button Clicking the Set button opens the Set Window.
Accessing a Common Database The GX-2012 Data Logger Management Program stores downloaded data in a database file. This database file is automatically stored on the computer’s hard drive in the same folder as the GX-2012 Data Logger Management Program. In this configuration, a computer has access to its own database but no other computer’s. Only data downloaded to that computer may be viewed. If the database was set up on a network location, multiple computers could access the same database.
3. Open GX2012.ini file in Notepad and scroll down to the very last line. This line is the Data Location path. An example of the path created by the program is shown in Figure 9. Replace the current path with the desired path (see Figure 10). Old file path Figure 9: GX2012.
New file path Figure 10: GX2012.ini File with New Path 4. Save the file and reopen the GX-2012 Data Logger Management Program. 5. When you launch the program again, a database will be created in the specified location. 6. Repeat steps 2-5 for all installations that need access to the common database.
Downloading Data from an Instrument You have the option of downloading data manually or automatically. If you want to download data using the automatic download feature, click the Automatic Download selection box in the Download Window before attempting to download data from the instrument. Remember that if Automatic Download is selected, the Instrument Information Window will remain blank and the instrument will turn off automatically after the data has been downloaded.
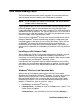
If your computer does not have a built in infrared port, place the instrument within an inch or two of the infrared port on the IrDA adapter cable as shown in Figure 12 below, aligning the infrared port below the RESET SILENCE button on the instrument with the infrared port on the cable. GX-2012 To Computer USB Port Cable's Infrared Port Infrared Port Figure 12: Aligning the Instrument with the Cable Infrared Receiver 3.
connection is in effect. 4. If you selected Automatic Download, the downloading process begins automatically after a successful connection is made. If Automatic Download is not selected, the Complete Download, Instrument Information, and Power Off Download Commands become selectable. 5. If you are going to download data manually, you can perform a complete download, download only the instrument information, or download only the data files by using the Download Commands.
Use to download all data Use to download subsets of the data Clear data button Download messages Instrument ID Use to turn off instrument Figure 15: Download Messages & Download Commands 7. If the unit has been downloaded manually (Automatic Download not selected), the unit’s instrument information may be viewed after downloading by using the Instrument Information control button if the unit is still turned on and connected to the computer.
Figure 16: Instrument Information Window 8. You can view, print, export, or delete downloaded data by entering the Data or Last Calibration Windows. These windows are accessed by clicking Data or Last Calibration along the right side of the Download Window. See “Viewing, Printing, Exporting, & Deleting Data in the Data Window” on page 23 or “Last Calibration Button” on page 12. 9.
GX-2012 and Gas Tracer Data Logging Capacity Table 1: GX-2012 and Gas Tracer Data Logging Capacity, 5 Sensor Versions Interval Trend Time Data Logging Hours 10 seconds 10 hours 20 seconds 20 hours 30 seconds 30 hours 60 seconds 60 hours 180 seconds (3 minutes) 180 hours 300 seconds (5 minutes) 300 hours 600 seconds (10 minutes) 600 hours Table 1 above lists the GX-2012’s and the Gas Tracer’s data logging capacity for each interval trend time setting assuming no alarms or other events.
Viewing, Printing, Exporting, & Deleting Data in the Data Window The instrument logs seven types of data files: bump test data, calibration history, bar hole data, interval trend data, alarm trend data, snap log data, and event data. You can view, print, and export (save to a file) each of these types of data files. All of these types of data files can also be deleted. The deleting of files is password protected and is described in “Deleting Data in the Data Window” on page 59.
Double click to show data folders Click to expand folder Click to show interval trend files Interval trend files Figure 17: Data Window, Basic Data Organization The Data Window is divided into four frames. The upper left frame is the Data Frame and displays all the data folders. They are grouped under either the Gas Tracer or the GX-2012 icon in the upper left part of the frame. When you open the program for the first time, the GX-2012 icon will appear.
NOTE: In the examples that follow, the data will be shown organized by serial number. If you do not select any of the organization boxes or select the Station ID or User ID boxes instead of or in addition to the Serial No. box, your Data Window will look slightly different. The following examples also show the combustible channel as “CH4”. The combustible channel may also be “HC”. See the GX-2012 Operator’s Manual or Gas Tracer Operator’s Manual for details.
the right side of the program window. The Data Window will appear. Double click to show data folders Click to expand folder Click to show Bump Test File Bump Test File Figure 18: Data Window - Selecting Bump Test Files 2. If necessary, double-click the GX-2012 or Gas Tracer icon in the top of the Data Window’s upper left frame to see the folders of downloaded data. 3.
for each file. The date/time correspond to the date and time of the instrument download and not a date or time of a bump test. 6. Click the file to select it. The first two bump tests saved will be shown in the bottom right frame along with the total number of bump tests saved if it is more than two. Each saved bump test shows the date/time of the bump test, the gas, the test result, the concentration of gas used, and the result of the bump test. 7.
8. If you want to print the data, click the Print button. A Printer List dialog box will appear for you to select a printer. Figure 20: Printer List Dialog Box, Calibration History 9. Select a printer and click OK to print the data. 10. To export the data to another application, for example a spreadsheet or database, click the Export button. A “Save As” dialog box will appear for you to specify the filename, file type, and file location. The default file type is “.csv” (comma-separated values).
the program window and select the data you want to view. Calibration History The instrument is capable of saving information for up to 124 of the most recent bump tests and calibrations combined. This calibration history is retrieved by the Data Logger Management Program when data is downloaded from the instrument using either the Complete Download download command or the Download Logger Data download command. Instrument calibration information is also available in the Last Calibration Window.
To view, print, or export the calibration history for any instrument in the database: 1. With the program already launched, click the Data control button along the right side of the program window. The Data Window will appear. Double click to show data folders Click to expand folder Click to show Cal. Histories File Cal. Histories file Figure 22: Data Window - Selecting Calibration History Files 2.
for that instrument will appear in the top right frame. If multiple Station ID’s or User ID’s are used for an instrument, then more than one Calibration Histories file will appear. The serial number, station ID, user ID, and date/time appear on the line for each file. The date/time correspond to the date and time of the instrument download and not a date or time of calibration. 6. Click the file to select it.
8. If you want to print the data, click the Print button. A Printer List dialog box will appear for you to select a printer. Figure 24: Printer List Dialog Box, Calibration History 9. Select a printer and click OK to print the data. 10. To export the data to another application, for example a spreadsheet or database, click the Export button. A “Save As” dialog box will appear for you to specify the filename, file type, and file location. The default file type is “.csv” (comma-separated values).
the program window and select the data you want to view. Event Data The instrument not only saves trend files which include logged data at scheduled times, but also saves the 124 most recent alarm events and the 124 most recent trouble events. When an instrument is downloaded, the GX-2012 Data Logger Management Program will retrieve these events from that instrument and save them in alarm event files and trouble event files for each instrument that is downloaded.
data. 3. Find your instrument by serial number, then click the expanded view symbol (+) of or double-click the serial number folder to view the contents.The top folder is untitled and contains the Alarm Events Folder and Trouble Events Folder along with the Calibration History Folder and Bump Test Folder. The rest of the folders contain folders for the interval trend files, bar hole mode files, snap log files, and alarm trend files and are named and organized by date (month/year). 4.
7. Click the View Data button at the bottom of the Data Window or double-click the event file name to open the file and view it in table format. Event files can only be viewed in table format. Figure 27: Data View - Alarm Events Figure 28: Data View - Trouble Events 8. If you click the Summary button, the Data Window will split into two frames one above the other with the event list in the lower frame and the summary information shown in the upper frame.
9. If you want to print the data, click the Print button. A Printer List dialog box will appear for you to select a printer. Figure 29: Printer List Dialog Box, Event Data 10. Select a printer and click OK to print the data. 11. To export the data to another application, for example a spreadsheet or database, click the Export button. A “Save As” dialog box will appear for you to specify the filename and file location. The default file type is “.csv” (comma-separated values).
Bar Hole Data To view, print, or export bar hole mode data for any instrument in the database: 1. With the program already launched, click the Data control button along the right side of the program window. The Data Window will appear. Double click to show data folders Click to expand folder Click to show Bar Hole Data File Bar Hole Data Files Figure 31: Data Window - Selecting Bar Hole Data Files 2.
hole tests. Each bar hole test has its own bar hole file. A Bar Hole Folder has been opened in the example in Figure 32. The serial number, station ID, user ID, and date/time appear on the line for each bar hole data file. The date/time correspond to the date and time that the instrument was downloaded and not the date and time the file was created. Each file corresponds to one bar hole test. 6. Click one of the bar hole data file names.
for you to specify the filename and file location. The default file type is “.csv” (comma-separated values). Figure 34: Save as Dialog Box 11. After specifying the file name, file location, and file type click the Save button to save the file to the specified location. 12. To go back and view other data, click the Return button in the upper right corner of the Data Window or the Data button on the right side of the program window and select the data you want to view.
Snap Log Data Snap log data can be taken in Normal Operation or in Leak Check Mode Operation. Normal Operation Snap Log Data Normal Operation Snap Log Data can be taken on GX-2012 and Gas Tracer instruments. To view, print, or export normal operation snap log data for any instrument in the database: 1. With the program already launched, click the Data control button along the right side of the program window. The Data Window will appear.
4. Click the expanded view symbol (+) of or double-click the dated folder whose contents you want to see. 5. Click the Normal Op Snap Log folder. One or more snap log files will appear in the top right frame. One snap log file is generated for all normal operation snap logs taken during an operating session. If you turn the instrument off and turn it back on, a new snap log file will be created. The serial number, start date/time, and end date/time appear on the line for each snap log data file.
8. If you want to print the data, click the Print button. A Printer List dialog box will appear for you to select a printer. Figure 37: Printer List Dialog Box, Event Data 9. Select a printer and click OK to print the data. 10. To export the data to another application, for example a spreadsheet or database, click the Export button. A “Save As” dialog box will appear for you to specify the filename and file location. The default file type is “.csv” (comma-separated values).
Leak Check Snap Log Data Leak Check Snap Log Data can be taken on GX-2012 and Gas Tracer instruments. To view, print, or export leak check snap log data for any instrument in the database: 1. With the program already launched, click the Data control button along the right side of the program window. The Data Window will appear.
check snap logs taken during an operating session. If you turn the instrument off and turn it back on, a new snap log file will be created. The serial number, start date/time, and end date/time appear on the line for each snap log data file. The start date/time corresponds to the date and time that the instrument was turned on. The end date/time corresponds to the date and time that the instrument was turned off. 6. Click one of the snap log data file names.
8. If you want to print the data, click the Print button. A Printer List dialog box will appear for you to select a printer. Figure 41: Printer List Dialog Box, Event Data 9. Select a printer and click OK to print the data. 10. To export the data to another application, for example a spreadsheet or database, click the Export button. A “Save As” dialog box will appear for you to specify the filename and file location. The default file type is “.csv” (comma-separated values).
Interval Trend Data Average gas concentrations over the user defined interval trend time are logged in the interval trend data files. The interval trend time can be set in the Set window. See “Changing Instrument Parameters” on page 73. It can also be set in the instrument’s Maintenance Mode. See the GX-2012 Operator’s Manual or the Gas Tracer Operator’s Manual for instructions to set the interval trend time.
To view and perform desired operations with the interval trend files: 1. With the program already launched, click the Data control button along the right side of the program window. The Data Window will appear. Double click to show data folders Click to expand folder Click to show interval trend files Interval trend files Figure 43: Data Window - Selecting Interval Trend Data Files 2.
for each interval trend file. The date/time is the date and time that the data file was created and data began being recorded in that file. 6. Click one of the interval trend data file names. A summary will appear in the bottom right frame with instrument and alarm setting information. If you want to view, graph, print, or export the interval trend data, double-click the filename or click the View Data button at the bottom of the window. 7.
• In table format, the interval trend data is shown as the average gas readings over the user defined interval trend time. So if the data logging session started at 4:13:38 PM and the interval time is set to 1 minute, then the readings logged at 4:14:38 PM are the average reading for each channel over that one minute period. • Events are displayed on the screen under the channel in which they occur and with the time of the event.
when an alarm trend data file is displayed in this way. To return to the interval trend data file, click the Return button or click the “X” in the upper right corner of the new window to close the window. Click to return to interval trend data Figure 46: Data Displayed by Alarm Trend Cursor Symbol 9. To view only events in the interval trend data file, click the Events Only selection box to select it. 10. To view the interval trend data in condensed form, click the Condensed selection box to select it.
to be able to display it in graph format. NOTE: Zoom level The data count shown when you have selected an interval trend data file, as in Figure 43 above, can be more than five if you have events, such as the instrument going into and out of alarm, but you may not have five scheduled data points.
levels than sessions that show stable data to allow for viewing of gas reading changes in greater detail. • When selected, the Cursor feature allows you to display the gas reading and log time for each data point saved on the graph. The number of data points on the graph is minimized depending on the length of a data session by several means including omitting consecutive data points that have the same gas readings.
14. To export the data to a file so it can be used by another application, for example a spreadsheet or database (for table data) or a word processing or presentation program (for graph data), click the Export button. A “Save As” dialog box will appear for you to specify the filename, file location, and file type. Figure 49: Save as Dialog Box For Graph view, the export file type is Windows bitmap (.bmp). For Table view, the default file type is “.csv” (comma-separated values).
alarm event occurs, the data during this time is left blank. If the instrument is turned off less than 30 minutes after an alarm event occurs, the data file will only have logged data until the unit was turned off. NOTE: If you are operating your instrument in Inert Mode with the oxygen alarm pattern set to H-HH, the maximum reading for the oxygen channel will be saved every 5 seconds instead of the minimum. The instrument saves up to 8 alarm trend files.
3. Find your instrument by serial number, then click the expanded view symbol (+) of or double-click the serial number folder to view the contents.The top folder is untitled and contains the Calibration History folder and Bump Test Data Folder along with folders for alarm events and trouble events. The rest of the folders contain folders for the interval trend files, bar hole mode data, snap log data, and alarm trend files and are named and organized by date (month/year). 4.
7. Alarm trend data can be viewed in either table or graph format by selecting the Table or Graph selection buttons. The example below in Figure 51 is in table format. Click to save data to a file Select table or graph view Click for a summary of the data Click to print data Alarm Event Figure 51: Alarm Trend Data in Table Format • In table format, the log times are shown along with the peak (minimum for oxygen) gas readings for the previous five seconds.
8. To view the data in graph format, click the Graph button. An alarm trend file can always be graphed regardless of the number of logged points. Alarm event and gas concentration Cursor feature Zoom level Figure 52: Alarm Trend Data in Graph Format When viewing alarm trend data in graph format, you have several options: • You can choose which gas you want to graph • You can choose the zoom level, or displayed time interval, on the graph. The zoom feature shows greater detail relative to time.
to move the readings up or down on the screen. • If you click the Summary button, the data window will split into two frames, one above the other, with the graph in the lower frame and the summary information shown in the upper frame. The summary information is the same as the information shown in the lower right frame in Figure 50. To return to the one frame format, click Summary again.
11. To export the data to another application, for example a spreadsheet or database (for table data) or a word processing or presentation program (for graph data), click the Export button. A “Save As” dialog box will appear for you to specify the filename, file location, and file type. Figure 54: Save as Dialog Box For Graph view the export file type is Windows bitmap (.bmp). For Table view the default file type is “.csv” (comma-separated values).
To delete any of the above items in the Data Window: 1. With the program launched, click the Data control button on the right side of the program window. 2. Find the folder or file you want to delete. 3. Place the cursor on the folder or file you want to delete and click it with the right mouse button. The Delete box will appear. Figure 55: Delete Box 4. Click Delete with the left mouse button. The Password Window appears. Figure 56: Password Window 5. Enter the password and click Continue.
Sample Window (if a file is selected for deletion) will appear asking you to confirm that you want to delete the selected folder or file. In the example below, the Delete Data Window appears because the data folder shown in Figure 55 has been selected for deletion. Figure 57: Delete Data Window 7. If you want to delete the selected item, click Yes. The item will be deleted by the program. If you do not want to delete the selected item, click No and the operation will be cancelled.
Changing the Password CAUTION: Changing the password requires use of the Delete box. Take care to avoid accidentally deleting data if you decide to change the password. It is possible to change that password as follows: 1. Right-click a data folder, data file, or event file. The Delete box will appear. Figure 58: Delete Box 2. Click Delete with the left mouse button. The Password Window appears.
3. Click Change Password. The Password Window asks you to input the current password. Figure 60: Inputting Current Password 4. Type the current password, then click Current password. The Password Window asks you to input the new password. Figure 61: Inputting New Password 5. Type the new password and click New Password. The Password Window asks you to input the new password again to confirm it. Figure 62: Confirming New Password 6. Type the new password again, then click Confirm New Password. 7.
Last Calibration Window You can access data on the most recent successful calibration and bump test for each instrument that has been downloaded in the Last Calibration Window. You can view, print (calibration date/bump test date only), and delete this data in the Last Calibration Window. NOTE: If the GX-2012 Data Logger Management Program database is on the user’s computer (default setting), data will only appear for instruments downloaded to that computer.
Figure 64: Last Calibration Window: BUMP DSP Off If any instrument has been downloaded to the GX-2012 Data Logger Management Program using the Complete Download or Instrument Information download buttons that has the BUMP DSP parameter set to On, the Last Calibration Window will appear as below. The screen below is shown with the Need Calibration and Need Bump Test options selected.
Figure 65: Last Calibration Window: Bump Test Function On The following screens are shown with the Bump Test portion of the window active. If the BUMP DSP on all of the instruments you have downloaded is set to Off, you will not see the Bump Test portion of these screens. For more information on setting the BUMP DSP parameter, see the GX-2012 Operator’s Manual or Gas Tracer Operator’s Manual.
while the bump test data appears in the bottom half of the screen. NOTE: The calibration interval, the number of days after a calibration that a new calibration is due, is saved in the instrument but it is only accessible in the instrument’s Maintenance Mode. If the calibration time limit is changed in the instrument using Maintenance Mode, the new calibration time limit value will not be known by the program until the instrument is downloaded.
was calibrated or bump tested for each of the target gases using the MM/DD/YY format and 24-hour military standard time. • Last Downloaded — shows when the last download took place for a unit using the MM/DD/YY format and 24-hour military time standard. The instruments that are due for calibration or bump testing (in the case of the Need Calibration/Need Bump Test view option, that will be all of them), will have their last calibration date or last bump test date highlighted in red.
Calibration Date/Bump Test Date View Option Selecting this option shows the last calibration date, last bump test date, and the last download date for all the instruments that are in the program’s database. The fields for the Calibration Date/Bump Test Date view option are the same as for the Need Calibration/Need Bump Test view option.
Calibration Record/Bump Test Record View Option Selecting the Calibration Record/Bump Test Record view option shows detailed calibration or bump test information for each instrument’s most recent successful calibration or bump test. Figure 70: Last Calibration Window: Calibration Record View Option The fields on this screen include SerialNo, UserID, and StationID just as in the Need Calibration/Need Bump Test and Calibration Date/Bump Test Date screens.
NOTE: • If a unit is calibrated using One Cal in the instrument’s Calibration Mode (see the GX-2012 Operator’s Manual or Gas Tracer Operator’s Manual) it is possible for the “After” reading to be different from the “A.Cal” setting if the unit was set to a level different than the “A.Cal” setting. Cal. Due (Days) — shows when calibration is due in days (e.g., “Remaining 25 Day” means that calibration is due in 25 days, and “Now” means that calibration is due immediately).
4. Click the row with the right mouse button. The Delete box appears. Figure 71: Delete Box 5. Click Delete with the left mouse button. The Password window appears. Figure 72: Password Window, Deleting Last Calibration Data 6. Enter the password and click the Continue button. The password when the software is first installed is “rki”. The password is case sensitive. See “Changing the Password” on page 62 for instructions to change the password if desired. 7.
NOTE: Deleting instrument data from the folder list along the left side of the Data screen will not delete calibration data from the Last Calibration screen. Data in the Last Calibration screen must be deleted manually. Set Window Changing Instrument Parameters To make changes to parameters stored in the instrument, use the GX-2012’s Data Logger Management Program’s Set Window. Follow the steps below to make these changes. 1. Launch the GX-2012 Data Logger Management Program. 2.
5. Click the Set button to display the Set Window. Use the GX-2012 Status Frame and the Gas/Sensor Frame to change parameters stored in the instrument. Click to upload changes to instrument Figure 74: Set Window 6. To change the serial number stored in the instrument, click the serial number field and use the backspace key to remove the current entry, then type the new serial number. 7.
information to the instrument by clicking the Update button, then confirming that you want to update the information by clicking the Yes button when the Update window appears. Figure 75: Update Window 11. To update the instrument’s date and time to match the computer’s, click the Date/Time Set button and then click the Yes button when the Update window appears.
5. Click the Set button to display the Set window. Figure 76: Set Window Directly Editing Station and User ID Lists The station and user ID lists can be edited directly or through the use of csv files. Editing them directly is often more convenient if your station or user ID list is short. For longer ID lists, using csv files will be more convenient. See “Updating Station and User ID Lists Using CSV Files” on page 78 for instructions to use csv files.
1. Click the Detail Settings button in the Set window. If you do not currently have any User IDs or Station IDs programmed into the instrument, the screen will appear as shown below. Figure 77: Detail Settings Window The Station ID list is shown on the left and the User ID list is shown on the right. Both lists have Export csv file and Import csv file buttons located to the right of each list. If the instrument had any station or user IDs, they would be displayed in the appropriate list. 2.
upload any other changes you have made, click Update and click OK when the confirmation box appears. Updating Station and User ID Lists Using CSV Files Station and user ID lists can also be edited by using csv files. A Station csv file and a User csv file are provided with the program but you can also create your own csv file. 1. Click the Detail Settings button in the Set window. If you do not currently have any User IDs or Station IDs programmed into the instrument, the screen will appear as shown below.
2. To create a new ID list, click the Export csv file button located to the right of the Station ID list or the User ID list. In the example below, the Export csv file button to the right of the Station ID list was clicked. Figure 79: Station ID CSV File Save As Navigate to the location you would like to save the csv file, type in a file name, and click Save. 3. The csv files can be opened, edited, and saved using a word processing program such as Word, WordPad, or Notepad.
Figure 80: Station ID CSV File Opened in WordPad Any existing Station or User IDs will be displayed. Undefined Station or User IDs will appear as dashes. To edit a Station or User ID, delete either the existing name or the dashes and replace them with the desired name. The name may consist of any uppercase letter or number and can be up to 16 characters long.
Importing CSV Files 1. Locate an existing Station ID or User ID csv file. See above for instructions to generate a csv file. 2. In the Detail Settings window, click “Import csv file” for either the Station ID or User ID and select a csv file.
3. Select the file you want to import and click Open. Figure 82: Import csv File 4. Once the Station ID and/or User ID lists have been imported, click OK to save changes and return to the Set window. If you do not want to save the changes, click Cancel. 5. The new station and user ID lists will be visible in the Station ID and User ID selection boxes in the Set window. Use the drop down menu to select a current station and user ID for the instrument. 6.
Changing the Appearance of the Program Screens To change how information is displayed in the program (e.g., text font or graph colors), use the program’s Set Window. Follow the steps below to make changes. 1. Launch the GX-2012 Data Logger Management Program. 2. Click the Set button to display the Set window. Use the Font And Color Frame in the left side of the window to change fonts and graph colors.
Figure 85: Font Window 4. Select the colors used to graph the various target gases in the interval trend and alarm trend data files by clicking the appropriate Graph Color button on the left side of the Set Window in the Font and Color frame. Figure 86: Color and Custom Color Windows • The Color Window shown on the left above appears when the Graph Color button is clicked.
Colors button and the Custom Color Window shown on the right above replaces the Color Window. 5. After making the desired changes, click OK. 6. The changes you have made will take effect after you exit and restart the program. Instrument Power Off To turn a connected instrument off: 1. Select the Download button if you are not already in the Download window. 2. Click the Power Off button. The instrument will shut off. 3.
Spare Parts List Table 2: Spare Parts List Part Number Description 47-5027RK Cable, USB/IrDA adapter 71-0245RK GX-2012 Data Logger Management Program Operator’s Manual (this document) 71-8004RK GX-2012 Product CD, Includes the GX-2012 Data Logger Management Program, and Operator’s Manuals 86 • Spare Parts List