GX-2009 Data Logger Management Program Operator’s Manual Part Number: 71-0163RK Revision: C Released: 3/19/12 www.rkiinstruments.
Warranty RKI Instruments, Inc. warrants gas alarm equipment sold by us to be free from defects in materials and workmanship, and performance for a period of one year from date of shipment from RKI Instruments, Inc. Any parts found defective within that period will be repaired or replaced, at our option, free of charge.
Table of Contents Warranty . . . . . . . . . . . . . . . . . . . . . . . . . . . . . . . . . . . . . . . . . . . . . . . . . . 2 Table of Contents . . . . . . . . . . . . . . . . . . . . . . . . . . . . . . . . . . . . . . . . . . . 3 Introduction . . . . . . . . . . . . . . . . . . . . . . . . . . . . . . . . . . . . . . . . . . . . . . . 5 System Requirements . . . . . . . . . . . . . . . . . . . . . . . . . . . . . . . . . . . . . . . 6 Installing the GX-2009 Data Logger Management Program . . . . . . .
Interval Trend Data . . . . . . . . . . . . . . . . . . . . . . . . . . . . . . . . . . . . . 45 Alarm Trend Data . . . . . . . . . . . . . . . . . . . . . . . . . . . . . . . . . . . . . . 54 Deleting Data in the Data Window . . . . . . . . . . . . . . . . . . . . . . . . . . 60 Changing the Password . . . . . . . . . . . . . . . . . . . . . . . . . . . . . . . . . 63 Viewing, Printing, & Deleting Data in the Last Calibration Window . .
Introduction NOTE: The bump test function in Calibration Mode is included in instruments with firmware version 03955 or later installed. See the GX-2009 Operator’s Manual for a description of the bump test function. GX-2009 instruments shipped after May 2011 include the bump test function. Instruments that have a serial number starting with 04516 or later shipped from the factory with the bump test function available.
• view, print, and save data • change data logging parameters • change the appearance of the software screens • change the color of graphed readings for a particular gas Before you get started, be sure to review the system requirements in the next section. CAUTION: The GX-2009 detects oxygen deficiency and elevated levels of oxygen, combustible gases, carbon monoxide, and hydrogen sulfide, all of which can be dangerous or life threatening.
• CD-ROM Drive • Infrared port or USB port and a USB/IrDA adapter cable Installing the GX-2009 Data Logger Management Program 1. Launch Windows®. 2. Exit from all applications and open windows. 3. There are two ways to install the GX-2009 Data Logger Management Program: by using the GX-2009 Product CD or by using the GX-2009 Data Logger Management Program Installation CD. • If you are using the GX-2009 Product CD, insert the Product CD in your computer’s CD-ROM drive.
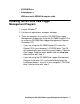
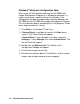
4. After a few seconds, a screen appears indicating that the InstallShield Wizard is preparing to install the Data Management Program, then the GX-2009 InstallShield Wizard window appears to guide you through installation. Figure 1: GX-2009 Data Management Installation Program 5. Follow the on-screen instructions in the InstallShield Wizard Window to install the program. 6.
IrDA Downloading Cable The GX-2009 communicates with a computer via an on-board infrared communication port that complies with IrDA protocol standards. NOTE: If your computer has a built-in infrared port, you do not need an adapter cable to download data. If your computer does not have an infrared port, you will need to install an IrDA/USB adapter cable on your computer to use the GX-2009 Data Logger Management Program with your GX-2009. The IrDA/USB cable is available from RKI Instruments, Inc.
Windows® Wireless Link Operation Note When using an IrDA adapter cable and the GX-2009 Data Logger Management Program on a Windows® computer, it is necessary to make a special setting in the Wireless Link Configuration window for proper communication between the GX-2009 and the GX-2009 Data Logger Management Program. This must be done before attempting to use the program. Follow these steps to make this setting: 1. Click Start on the Windows® Icon Tray. 2.
Deselect Figure 2: Image Transfer Tab 6. Click OK. 7. Close the Control Panel window.
Launching the Program 1. Click Start on the Windows® Icon Tray, then select All Programs, then select GX-2009. Your operating system may also have a shortcut installed in the Start menu. 2. The program will launch and the Download window will appear. Figure 3: The Download Window 3. For convenience, make a shortcut of the GX-2009 Data Logger Management Program and place it on the Windows® desktop. See your Windows® documentation for information about making shortcuts.
Control Buttons This section provides an overview of the control buttons. Instructions for using the various parts of the program accessed by the control buttons are given in other parts of this manual. When the program is launched, it opens in the Download Window. Along the right side of the Download Window are six control buttons that access other windows in the program.The figure below shows the various windows that you can access when you click the control buttons.
Download Button If you are in another program window, clicking the Download button opens the Download Window (see Figure 3). The Download window has several download commands that allow you to perform various data retrieval functions with an instrument that is connected to the software. Data can be retrieved from the instrument, data can be cleared from the instrument, and the instrument can be turned off.
commands and is currently connected to the program. If an instrument is turned off after being connected to the program, then the program will lose the connection with the instrument and the fields in the Instrument Information Window will become empty. Data Button Clicking the Data button opens the Data Window. Figure 6: Data Window In the Data Window, you can view, print, export, and delete data that has been downloaded from instruments.
NOTE: If the GX-2009 Data Logger Management Program database is on the user’s computer (default setting), data will only appear for instruments downloaded to that computer. If the database is on a network, data will appear for all instruments downloaded to that database. See “Accessing a Common Database” on page 20 for more instruction. The following types of data files are saved in the Data window: • Bump Test Files A bump test file is saved for each instrument that has been downloaded.
• Alarm Trend Data Files Alarm trend data is logged around an alarm event. The GX-2009 can save up to 8 alarm trend data files in its memory. • Alarm Event Files Alarm event files record gas alarm events that have been downloaded from instruments. The GX-2009 can save up to 100 alarm events in its memory. • Trouble Event Files Trouble event files record sensor failure and system failure events that have been downloaded from instruments. The GX-2009 can save up to 100 trouble events in its memory.
Figure 7: Last Calibration Window The Last Calibration Window stores the information for the most recent successful calibration and for the most recent successful bump test for each GX-2009 that has been downloaded. Calibration data is displayed in the top part of the screen while bump test data is displayed in the bottom part. You can display the information three ways by using the Need Calibration/Need Bump Test, Calibration Date/Bump Test Date, or Calibration Record/Bump Test Record selection buttons.
Set Button Clicking the Set button opens the Set Window.
Accessing a Common Database The GX-2009 Data Logger Management Program stores downloaded data in a database file. This database file is automatically stored on the computer’s hard drive in the same folder as the GX-2009 Data Logger Management Program. In this configuration, a computer has access to its own database but no other computer’s. Only data downloaded to that computer may be viewed. If the database was set up on a network location, multiple computers could access the same database.
last line. This line is the Data Location path. An example of the path created by the program is shown in Figure 9. Replace the current path with the desired path (see Figure 10). Old file path Figure 9: GX2009.
New file path Figure 10: GX2009.ini File with New Path 4. Save the file and reopen the GX-2009 Data Logger Management Program. 5. When you launch the program again, a database will be created in the specified location. 6. Repeat steps 2-5 for all installations that need access to the common database.
Downloading Data from the GX-2009 You have the option of downloading data manually or automatically. If you want to download data using the automatic download feature, click the Automatic Download selection box in the Download Window before attempting to download data from the GX-2009. Remember that if Automatic Download is selected, the Instrument Information Window will remain blank and the GX-2009 will turn off automatically after the data has been downloaded.
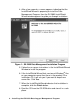
IrDA adapter cable as shown in Figure 12 below, aligning the infrared port on the side of the GX-2009 with the infrared port on the cable. GX-2009 To Computer USB Port Sensor Diffusion Port, 4X Cable's Infrared Port Infrared Port Figure 12: Aligning the GX-2009 with the Cable Infrared Receiver 3. Press and hold the POWER MODE button on the GX-2009 until you hear a beep, then release it. The GX-2009 will begin its power up sequence.
Commands become selectable. 5. If you are going to download data manually, you can perform a complete download, download only the instrument information, or download only the data files by using the Download Commands. • To download all data and instrument information from the instrument, click Complete Download. Figure 14: Download Commands • To download instrument information only, click Instrument Information. • To download all data, click Download Logger Data.
Use to download all data Use to download subsets of the data Clear data button Download messages Instrument ID Use to turn off GX-2009 Figure 15: Download Messages & Download Commands 7. If the unit has been downloaded manually (Automatic Download not selected), the unit’s instrument information may be viewed after downloading by using the Instrument Information control button if the unit is still turned on and connected to the computer.
Figure 16: Instrument Information Window 8. You can view, print, export, or delete downloaded data by entering the Data or Last Calibration Windows. These windows are accessed by clicking Data or Last Calibration along the right side of the Download Window. See “Viewing, Printing, Exporting, and Deleting Data in the Data Window” on page 29 or “Last Calibration Button” on page 17. 9.
GX-2009 Data Logging Capacity Table 1: GX-2009 Data Logging Capacity Interval Trend Time Data Logging Hours 10 seconds 10 hours 30 seconds 30 hours 60 seconds 60 hours 180 seconds (3 minutes) 180 hours 300 seconds (5 minutes) 300 hours 600 seconds (10 minutes) 600 hours Table 1 above lists the GX-2009’s data logging capacity for each interval trend time setting assuming no alarms or other events.
Viewing, Printing, Exporting, and Deleting Data in the Data Window The GX-2009 logs four types of data files: calibration history, interval trend data, alarm trend data, and event data. You can view, print, and export (save to a file) each of these types of data files. All of these types of data files can also be deleted. The deleting of files is password protected and is described in “Deleting Data in the Data Window” on page 60.
Double-click to show data folders Click to expand folder Click to show interval trend files Interval trend files Figure 17: Data Window, Basic Data Organization The Data Window is divided into four frames. The upper left frame is the Data Frame and displays all the data folders. They are grouped under the GX-2009 icon in the upper left part of the frame. If the data folders are not visible, double click the GX-2009 icon to make them visible.
NOTE: In the examples that follow, the data will be shown organized by serial number. If you do not select any of the organization boxes or select the Station ID or User ID boxes instead of or in addition to the Serial No. box, your Data Window will look slightly different. The following examples also show the combustible channel as “CH4”. The combustible channel may also be “HC”. See the GX-2009 Operator’s Manual for details.
information that can be accessed by the Last Calibration button. All downloaded bump test information for all downloaded instruments is available in the Bump Test folders in the Data Window. This information is saved in a Bump Test Folder that is located in an untitled folder for each instrument. The bump test files are differentiated by instrument. The bump test information available here is more comprehensive than that in the Last Calibration Window.
Data Window’s upper left frame to see the folders of downloaded data. 3. Find your instrument by serial number, then click the expanded view symbol (+) of or double-click the serial number folder to view the contents.The top folder is untitled and contains the Bump Test Folder along with folders for calibration history, alarm events, and trouble events. The rest of the folders contain folders for the interval trend files and alarm trend files and are named and organized by date (month/year). 4.
7. To view the Bump Test file in table format, double click the Bump Test file or click the View Data button. Bump Test files can only be viewed in table format. Figure 19: Data View, Bump Test 8. If you want to print the data, click the Print button. A Printer List dialog box will appear for you to select a printer. Figure 20: Printer List Dialog Box, Calibration History 9. Select a printer and click OK to print the data. 10.
type, and file location. The default file type is “.csv” (commaseparated values). Figure 21: Save as Dialog Box After specifying the file name, file type, and file location click the Save button to save the file to the specified location. 11.To go back and view other data, click the Return button in the upper right corner of the Data Window or the Data button on the right side of the program window and select the data you want to view.
Instrument calibration information is also available in the Last Calibration Window. The information regarding the most recent successful calibration and bump test for each downloaded instrument along with whether or not an instrument is due for calibration or bump testing can be accessed using the Last Calibration button on the right side of the program window.
To view, print, or export the calibration history for any instrument in the database: 1. With the software already launched, click the Data control button along the right side of the program window. The Data Window will appear. Double-click to show data folders Click to expand folder Click to show Cal. Histories File Cal. Histories file Figure 22: Data Window - Selecting Calibration History Files 2.
4. Click the expanded view symbol (+) of or double-click the untitled folder. The Calibration History folder will appear below the untitled folder along with the Bump Test, Alarm Events, and Trouble Events folders. 5. Click the Calibration History folder. The Calibration Histories file or files for that instrument will appear in the top right frame. If multiple Station ID’s or User ID’s are used for an instrument, then more than one Calibration Histories file will appear.
7. To view the Calibration Histories file in table format, double click the Calibration Histories file or click the View Data button. Calibration Histories files can only be viewed in table format. Figure 23: Data View, Calibration History 8. If you want to print the data, click the Print button. A Printer List dialog box will appear for you to select a printer. Figure 24: Printer List Dialog Box, Calibration History 9. Select a printer and click OK to print the data. 10.
As” dialog box will appear for you to specify the filename, file type, and file location. The default file type is “.csv” (commaseparated values). Figure 25: Save as Dialog Box After specifying the file name, file type, and file location click the Save button to save the file to the specified location. 11.To go back and view other data, click the Return button in the upper right corner of the Data Window or the Data button on the right side of the program window and select the data you want to view.
instrument and save them in alarm event files and trouble event files for each instrument that is downloaded. Alarm event files save the time, instrument channel, and alarm type of every gas alarm event that occurs on a particular instrument. Warning (low alarm), Alarm (high alarm), STEL, TWA, and overscale events are saved. Trouble event files note the time, whether the event is an instrument system failure or sensor failure and the specific type of failure.
downloaded data. 3. Find your instrument by serial number, then click the expanded view symbol (+) of or double-click the serial number folder to view the contents.The top folder is untitled and contains the Alarm Events Folder and Trouble Events Folder along with the Calibration History Folder. The rest of the folders contain folders for the interval trend files and alarm trend files and are named and organized by date (month/year). 4.
7. Click the View Data button at the bottom of the Data Window or double-click the event file name to open the file and view it in table format. Event files can only be viewed in table format. Figure 27: Data View - Alarm Events Figure 28: Data View - Trouble Events 8. If you click the Summary button, the Data Window will split into two frames one above the other with the event list in the lower frame and the summary information shown in the upper frame.
9. If you want to print the data, click the Print button. A Printer List dialog box will appear for you to select a printer. Figure 29: Printer List Dialog Box, Event Data 10.Select a printer and click OK to print the data. 11.To export the data to another application, for example a spreadsheet or database, click the Export button. A “Save As” dialog box will appear for you to specify the filename and file location. The default file type is “.csv” (comma-separated values).
you want to view. Interval Trend Data Average gas concentrations over the user defined interval trend time are logged in the interval trend data files. The interval trend time is set using the GX-2009 User Setup Program. See the GX-2009 User Setup Program Operator’s Manual for instructions to set the interval trend time. Events such as gas alarms or sensor failures are saved in the interval trend data file when they occur.
To view and perform desired operations with the interval trend files: 1. With the program already launched, click the Data control button along the right side of the program window. The Data Window will appear. Double-click to show data folders Click to expand folder Click to show interval trend files Interval trend files Figure 31: Data Window - Selecting Interval Trend Data Files 2.
dated folder whose contents you want to see. 5. Click on the Interval Trend Folder. In the upper right frame of the Data Window, a list of file names will appear in the Name column. A prefix of “iv” indicates an interval trend data file. The serial number, station ID, user ID, and date/time appear on the line for each interval trend file. The date/time is the date and time that the data file was created and data began being recorded in that file. 6. Click one of the interval trend data file names.
Select table or graph view Click to see events only Click to see condensed data Click to print data Click to save data to a file Click to show session summary Click to return to Data Window Figure 32: Interval Trend Data in Table Format • In table format, the interval trend data is shown as the average gas readings over the user defined interval trend time.
POWER MODE button on the GX-2009. • If you click the Summary button, the Data Window will split into two frames, one above the other, with the data table in the lower frame and the summary information shown in the upper frame. The summary information is the same as the one shown in the lower right frame in Figure 31. To return to the one frame format, click Summary again. 8.
Click to return to interval trend data Figure 34: Data Displayed by Alarm Trend Cursor Symbol 9. To view only events in the interval trend data file, click the Events Only selection box to select it. 10.To view the interval trend data in condensed form, click the Condensed selection box to select it. When the data is condensed, the software shows only important and eventful data as follows: • The first and last scheduled data points in the session are shown.
• For any event, the data point before and after the event is always shown. 11.To view the data in graph format, click the Graph selection button. Five or more scheduled data points are required in an interval trend data file to be able to display it in graph format. NOTE: The data count shown when you have selected an interval trend data file, as in Figure 31 above, can be more than five if you have events, such as the GX-2009 going into and out of alarm, but you may not have five scheduled data points.
When viewing interval trend data in graph format, you have several options: • You can choose which gas you want to graph • You can choose the zoom level, or displayed time interval, on the graph. The zoom feature shows greater detail relative to time. Thus, the length of a time division on the graph will depend on both the length of the datalogging session and on the zoom factor.
12.To print the data, whether it is viewed in table or graph format, click the Print button. A Printer List dialog box will appear for you to select a printer. Figure 36: Printer List Dialog Box, Interval Data 13.Select a printer and click OK to print the data. Data displayed in Graph view will print as a graph and data displayed in Table view will print as a table. 14.
For Graph view, the export file type is Windows bitmap (.bmp). For Table view, the default file type is “.csv” (commaseparated values). After specifying the file name, file location, and file type click the Save button to save the file to the specified location. 15.To go back and view other data, click the Return button in the upper right corner of the Data Window or the Data button on the right side of the program window and select the data you want to view.
To view and perform desired operations with the alarm trend files: 1. With the software already launched, click the Data control button along the right side of the program window. The Data Window will appear. Double-click to show data folders Click to expand folder Click to show alarm trend files Alarm trend files Figure 38: Data Window - Selecting Alarm Trend Data Files 2. If necessary, double-click the GX-2009 icon in the top of the Data window’s upper left frame to see the folders of downloaded data.
the upper right frame of the Data window, a list of file names will appear in the Name column. A prefix of “al” indicates an alarm trend data file. The serial number, station ID, user ID, and date/time appear on the line for each alarm trend file. The date/time is the date and time that the data file was created and data began being recorded in that file. 6. Click one of the alarm trend data file names. A summary will appear in the bottom right frame with instrument and alarm setting information.
Select table or graph view Click to print data Click to save data to a file Click for a summary of the data Alarm Event Figure 39: Alarm Trend Data in Table Format • In table format, the log times are shown along with the peak (minimum for oxygen) gas readings for the previous five seconds. • The gas readings at the time of the alarm event around which the logged data are centered are highlighted in red and are the instantaneous readings at that time.
8. To view the data in graph format, click the Graph button. An alarm trend file can always be graphed regardless of the number of logged points. Alarm event and gas concentration Zoom level Cursor feature Figure 40: Alarm Trend Data in Graph Format When viewing alarm trend data in graph format, you have several options: • You can choose which gas you want to graph • You can choose the zoom level, or displayed time interval, on the graph. The zoom feature shows greater detail relative to time.
the gas reading and log time for each data point in the alarm trend file. As you use the left and right arrow buttons on your keyboard to move the cursor across the graph horizontally, readings at specific log times are displayed. Use the up and down arrows on the keyboard to move the readings up or down on the screen. • If you click the Summary button, the data window will split into two frames, one above the other, with the graph in the lower frame and the summary information shown in the upper frame.
11.To export the data to another application, for example a spreadsheet or database (for table data) or a word processing or presentation program (for graph data), click the Export button. A “Save As” dialog box will appear for you to specify the filename, file location, and file type. Figure 42: Save as Dialog Box For Graph view the export file type is Windows bitmap (.bmp). For Table view the default file type is “.csv” (commaseparated values).
• Interval Trend and Alarm Trend data files To delete any of the above items in the Data Window: 1. With the program launched, click the Data control button on the right side of the program window. 2. Find the folder or file you want to delete. 3. Place the cursor on the folder or file you want to delete and click it with the right mouse button. The Delete box will appear. Figure 43: Delete Box 4. Click Delete with the left mouse button. The Password Window appears.
5. Enter the password and click Continue. The password when the program is first installed is “rki”. The password is case sensitive. See “Changing the Password” on page 63 for instructions to change the password if desired. 6. When the password has been entered and Continue clicked, the Delete Data Window (if a folder is selected for deletion) or Delete Sample Window (if a file is selected for deletion) will appear asking you to confirm that you want to delete the selected folder or file.
Changing the Password CAUTION: Changing the password requires use of the Delete box. Take care to avoid accidentally deleting data if you decide to change the password. It is possible to change that password as follows: 1. Right-click a data folder, data file, or event file. The Delete box will appear. Figure 46: Delete Box 2. Click Delete with the left mouse button. The Password Window appears.
3. Click Change Password. The Password Window asks you to input the current password. Figure 48: Inputting Current Password 4. Type the current password, then click Current password. The Password Window asks you to input the new password. Figure 49: Inputting New Password 5. Type the new password and click New Password. The Password Window asks you to input the new password again to confirm it. Figure 50: Confirming New Password 6. Type the new password again, then click Confirm New Password.
7. Click OK when the program confirms that you have changed the password. Figure 51: Confirming New Password 8. Close the Password Window by clicking the red “X” in the upper right corner of the window.
Viewing, Printing, and Deleting Data in the Last Calibration Window You can access data on the most recent successful calibration and bump test for each instrument that has been downloaded in the Last Calibration Window. You can view, print (calibration date/bump test date only), and delete this data in the Last Calibration Window. NOTE: If the GX-2009 Data Logger Management Program database is on the user’s computer (default setting), data will only appear for instruments downloaded to that computer.
Effects of Bump Test Function Parameter Setting on Appearance of Last Calibration Window The setting of the Bump Test Function instrument parameter has an effect on the appearance of the Last Calibration Window. This instrument parameter can be set using the GX-2009 User Setup Program. The factory setting is Off.
If any instrument has been downloaded to the GX-2009 Data Logger Management Program using the Complete Download or Instrument Information download buttons that has the Bump Test Function parameter set to On, the Last Calibration Window will appear as below. The screen below is shown with the Need Calibration and Need Bump Test options selected. Only instruments that had the Bump Test Function instrument parameter turned On when downloaded will appear in the Bump Test portion of the window.
Operator’s Manual. Viewing and Printing Last Calibration Data Open the Last Calibration Window by clicking Last Calibration along the right side of the program window. When you open the Last Calibration Window the first time after launching the program, it will open with the Need Calibration/Need Bump Test view options selected. There are three view options in the Last Calibration window: Need Calibration/Need Bump Test, Calibration Date/Bump Test Date, and Calibration Record/Bump Test Record.
Figure 54: Last Calibration Window: Need Calibration View Option The Need Calibration/Need Bump Test view option shows the following fields for both calibration and bump test data: • No. — lists, in numerical order, the sequence of GX-2009s whose data have been downloaded to the computer. The most recently downloaded GX-2009 will be No. 1. • SerialNo — shows the serial number of the GX-2009 that was downloaded. • UserID — shows the user ID of the of the GX-2009 that was downloaded.
NOTE: Your GX-2009 may have less than 4 sensors installed. • Last Downloaded — shows when the last download took place for a unit using the MM/DD/YY format and 24-hour military time standard. The GX-2009s that are due for calibration or bump testing (in the case of the Need Calibration/Need Bump Test view option, that will be all of them), will have their last calibration date or last bump test date highlighted in red.
Calibration Date/Bump Test Date View Option Selecting this option shows the last calibration date, last bump test date, and the last download date for all the GX-2009s that are in the program’s database. The fields for the Calibration Date/Bump Test Date view option are the same as for the Need Calibration/Need Bump Test view option.
To print a list of the instruments shown in the Calibration Date/ Bump Test Date view option along with their user ID and last calibration date or last bump test date, click the Print button. A Printer List dialog box will appear. Figure 57: Printer List Dialog Box, Calibration Date View Option Select a printer and click the OK button to print the instrument list.
The fields on this screen include SerialNo, UserID, and StationID just as in the Need Calibration/Need Bump Test and Calibration Date/Bump Test Date screens. The Calibration Record fields also include the following: • Gas — Lists the target gas for which the Before, After, and A.Cal readings are displayed. • Before — shows the settings prior to calibration. • After — shows the settings after calibration. • A. Cal. — lists the auto-calibration setting for each channel of the GX-2009.
It is not possible to print any information when the Calibration Record/Bump Test Record view option is selected. To view and print all past calibrations for an instrument, see “Calibration History” on page 35. Deleting Last Calibration Data To delete an instrument and its calibration or bump test data from the Last Calibration Window: 1. With the program launched, click Last Calibration on the right side of the program window. The Last Calibration Window will appear. 2.
6. Enter the password and click the Continue button. The password when the software is first installed is “rki”. The password is case sensitive. See “Changing the Password” on page 63 for instructions to change the password if desired. 7. When the password has been entered and the Continue button clicked, the Delete History window will appear asking you to confirm that you want to delete the most recent calibration or bump test information for the selected instrument. Figure 61: Delete History Window 8.
Instrument Information, and Power Off download commands will be selectable. Click the Instrument Information download command to retrieve the instrument information from the GX-2009. If you wish to download data before making changes, click Complete Download instead of Instrument Information. 5. Click the Set button to display the Set Window. Use the GX-2009 Status Frame and the Gas/Sensor Frame to change parameters stored in the GX-2009. Click to upload changes to GX-2009 Figure 62: Set Window 6.
change (e.g. H2S AutoCal.) to select it, then type the new information. 9. After you have finished entering new parameters, you must upload this information to the GX-2009 by clicking the Update button, then confirming that you want to update the information by clicking the Yes button when the Update window appears. Figure 63: Update Window 10.To update the GX-2009’s date and time to match the computer’s, click the Date/Time Set button and then click the Yes button when the Update window appears. 11.
Changing the Appearance of the Program Screens To change how information is displayed in the program (e.g., text font or graph colors), use the program’s Set Window. Follow the steps below to make changes. 1. Launch the GX-2009 Data Logger Management Program. 2. Click the Set button to display the Set window. Use the Font And Color Frame in the left side of the window to change fonts and graph colors.
Figure 65: Font Window 4. Select the colors used to graph the various target gases in the interval trend and alarm trend data files by clicking the appropriate Graph Color button on the left side of the Set Window in the Font and Color frame. Figure 66: Color and Custom Color Windows • The Color Window shown on the left above appears when the Graph Color button is clicked.
• If you want to define a custom color, click the Define Custom Colors button and the Custom Color Window shown on the right above replaces the Color Window. 5. After making the desired changes, click OK. 6. The changes you have made will take effect after you exit and restart the program.