
Manual


38 • Viewing, Printing, Exporting, and Deleting Data
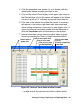
The data may be viewed either in table format or graph format if
at least 5 scheduled data points have been logged at the
programmed interval. If an interval data file has fewer than five
scheduled data points, the data cannot be graphed.
To view and perform desired operations with the interval trend
files:
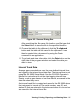
1. With the software already launched, click the Data control
button along the right side of the program window. The Data
window will appear.
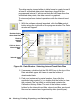
2. If necessary, double-click the GX-2003 icon in the top of the
Data window’s upper left frame to see the folders of
downloaded data.
3. Find your instrument by serial number, then click the
expanded view symbol (+) or double-click the folder to view
the contents.The top folder is untitled and contains the
Calibration History folder. The rest of the folders contain
folders for the interval trend files, alarm trend files, and event
files and are named and organized by date (month/year).
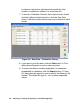
Figure 24: Data Window - Selecting Interval Trend Data Files
Double-click to
show data files
Click to
expand
folder
Click to show
interval trend
files
Interval trend
files