GX-2003 Data Logging Software Operator’s Manual Part Number: 71-0096RK Revision: A Released: 4/12/10 www.rkiinstruments.
Warranty RKI Instruments, Inc. warrants gas alarm equipment sold by us to be free from defects in materials and workmanship, and performance for a period of one year from date of shipment from RKI Instruments, Inc. Any parts found defective within that period will be repaired or replaced, at our option, free of charge.
Table of Contents Warranty . . . . . . . . . . . . . . . . . . . . . . . . . . . . . . . . . . . . . . . . . . . . . . . . . . 2 Table of Contents . . . . . . . . . . . . . . . . . . . . . . . . . . . . . . . . . . . . . . . . . . . 3 Introduction . . . . . . . . . . . . . . . . . . . . . . . . . . . . . . . . . . . . . . . . . . . . . . . 5 System Requirements . . . . . . . . . . . . . . . . . . . . . . . . . . . . . . . . . . . . . . . 6 Installing the GX-2003 Data Logging Software . . . . . . . . . . . .
Deleting Data . . . . . . . . . . . . . . . . . . . . . . . . . . . . . . . . . . . . . . . . . 53 Changing the Password . . . . . . . . . . . . . . . . . . . . . . . . . . . . . . . . . 54 Calibrating A GX-2003 With the Data Logging Software . . . . . . . . . . 56 Changing Data Logging Parameters . . . . . . . . . . . . . . . . . . . . . . . . . . 60 Changing the Appearance of the Software Screens . . . . . . . . . . . . . . 62 Spare Parts List . . . . . . . . . . . . . . . . . . . . . . . . . . . . . . .
Introduction Using an advanced detection system consisting of up to five gas sensors, the GX-2003 Personal Gas Monitor detects the presence of combustible gases, oxygen (O2), carbon monoxide (CO), and hydrogen sulfide (H2S) simultaneously. The GX-2003’s compact size and easy-to-use design makes it ideally suited for a wide range of applications as described in the GX-2003 Operator’s Manual, which you should read first before using the GX-2003 Data Logging Software.
CAUTION: The GX-2003 detects oxygen deficiency and elevated levels of oxygen, combustible gases, carbon monoxide, and hydrogen sulfide, all of which can be dangerous or life threatening. When using the GX-2003, you must follow the instructions and warnings in the GX-2003 Operator’s Manual to assure proper and safe operation of the unit and to minimize the risk of personal injury.
Installing the GX-2003 Data Logging Software 1. Launch Windows®. 2. Exit from all applications and open windows. 3. Insert the GX-2003 Data Logging Software Installation CD in your computer’s CD-ROM drive. 4. The installation program will automatically launch. and the GX-2003 Data Logger Program Install window appears.
5. Review the Confirmation section to make sure that your Windows® operating system has the minimum required service pack, minimum version of the MDAC module, and the minimum required version of Internet Explorer. Use the scroll bar on the right side of the program window to move up and down in the Installation Program. 6. Move to the Install Images section.
8. The installation process will begin. If a File Download window appears asking if you want to open or save a file, select Open. 9. The GX-2003 InstallShield Wizard screen appears. Follow the on-screen instructions in the Installation Wizard program to install the software. 10.If during software installation the installation program finds newer versions of Windows® files on your computer than those in the installation CD, it will ask you to keep these newer files. Click “Yes” to do so. 11.
IrDA Downloading Cable The GX-2003 communicates with a computer via an on-board infrared data port that complies with IrDA protocol standards. NOTE: If your computer has a built-in infrared port, you do not need an adapter cable to download data. If your computer does not have an infrared port, you will need to install an IrDA/serial adapter cable or an IrDA/USB adapter cable on your computer to download data to a PC from your GX2003. Both types of cables are available from RKI Instruments, Inc.
Logging Software on a Windows® computer, it is necessary to make a special setting in the Wireless Link Configuration window for proper communication between the GX-2003 and the software. This must be done before attempting to use the software. To make this setting, perform the following steps: 1. Click Start on the Windows® Icon Tray. 2. If Control Panel is available to select in the Start menu, select it. The Control Panel will appear.
6. Click OK. 7. Close the Control Panel window. Using a USB or Serial Port With an IrDA Cable Installed When an IrDA cable is installed on a USB or serial port, that port is always being used by the cable. If you need to use that port for another device, you must disable the IrDA/serial cable using Windows® and then shut down your computer before disconnecting it, starting your computer up again, and then using the port with another device or cable.
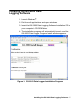
Launching the Software 1. Click Start on the Windows® Icon Tray, then select Programs, then select the GX-2003 folder, then select GX2003. Your operating system may also have a shortcut installed in the Start menu. 2. The program will launch and the Download window will appear. Figure 4: The Download Window 3. For convenience, make a shortcut of the GX-2003 Data Logging Software program and place it on the Windows® desktop. See your Windows® documentation for information about making shortcuts.
Control Buttons This section provides a description of the control buttons. Instructions for using the software are given in other parts of this manual. When the software is launched, the software opens in the Download window. Along the right side of the Download window are six control buttons that access other windows in the software.
Download Button If you are in another program window, clicking the Download button opens the Download window (see Figure 4). The Download window has several download commands that allow you to perform various data retrieval functions with an instrument that is connected to the software. Data can be retrieved from the instrument, data can be cleared from the instrument, and the instrument can be turned off.
and the fields in the Instrument Information window will become blank. Data Button Clicking the Data button opens the Data window. Figure 7: Data Window In the Data window, you can view, print, export, and delete data that has been downloaded from instruments. NOTE: If the GX-2003 Data Logger Program database is on the user’s computer (default setting), data will only appear for instruments downloaded to that computer.
The following types of data files are saved in the Data window: • Calibration History Files A calibration history file is saved for each instrument that has been downloaded. It records the calibration information for every calibration that was downloaded. The GX-2003 can save information for up to 20 calibrations in its memory. • Interval Trend Data Files Interval trend data is logged at the interval time defined in the GX-2003. Each logged point is an average reading over the previous time interval.
Last Calibration Button Clicking the Last Calibration button opens the Last Calibration window. Figure 8: Last Calibration Window The Last Calibration window stores the information for the most recent successful calibration on each channel for each GX-2003 that has been downloaded. Select one of the following display options by clicking on the appropriate selection button: Need Calibration, Calibration Date, or Calibration Record.
Figure 9: Last Calibration Information: Need Calibration Option • Need Calibration — selecting this option shows calibration information only for the GX-2003 units due for calibration. NOTE: The calibration interval value, the number of days after a calibration that a new calibration is due, is saved in the GX-2003.
NOTE: The GX-2003 units that are due for calibration will have calibration dates highlighted in red for the channels that are due. • No. — lists, in numerical order, the sequence of units whose data have been downloaded to the computer. The most recently downloaded unit will be No. 1. • SerialNo — shows the serial number of the unit that was downloaded. • UserID — shows the user ID of the of the unit that was downloaded. • StationID — shows the station ID of the unit that was downloaded.
Figure 10: Last Calibration Information: Calibration Record Option The fields also include the following: • Gas — Lists the target gas for which the Before, After, and A.Cal readings are displayed. The top CH4 is %LEL CH4 and the CH4 below the CO line is %volume CH4. NOTE: The row for %volume CH4 shows information from the most recent single calibration of the CH4 %volume channel. The %volume CH4 channel cannot be autocalibrated. • Before — shows the settings prior to calibration.
NOTE: If a unit is calibrated using the Single Calibration menu in the GX-2003 (see the GX-2003 instruction manual) it is possible for the “After” reading to be different from the “A.Cal” setting if the unit was set to a level different than the “A.Cal” setting. • Cal. Due (Days) — shows when calibration is due in days (e.g., “Remaining 25 day” means that calibration is due in 25 days, and “Now” means that calibration is due immediately).
Set Button Clicking the Set button opens the Set window.
Accessing a Common Database The GX-2003 Data Logging Software stores downloaded data in a database file. This database file is automatically stored on the computer’s hard drive in the same folder as the GX-2003 Data Logging Software. In this configuration, a computer has access to its own database but no other computer’s so only data downloaded to that computer may be viewed. If the database was set up on a network location, multiple computers could access the same database.
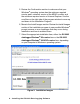
very last line. This line is the Data Location path. An example of the path created by the software is shown in Figure 12. Replace the current path with the desired path (see Figure 13). Old file path Figure 12: GX2003.
New file path Figure 13: GX2003.ini File with New Path 4. Save the file and reopen the GX-2003 Data Logging Software. 5. When you launch the program again, a database will be created in the specified location. 6. Repeat steps 2-5 for all installations that need access to the common database.
Downloading Data from the GX-2003 You have the option of downloading data manually or automatically. If you want to download data using the automatic download feature, click the Automatic Download selection box in the Download window before attempting to download data from the GX-2003. Remember that if Automatic Download is selected, the Instrument Information window will remain blank and the GX-2003 will turn off automatically after the data has been downloaded.
infrared port on the side of the GX-2003 with the infrared port on the cable. GX-2003 IrDA/USB or USB Connector IrDA/Serial Cable To Computer USB Port To Computer Serial Port Infrared Port Cable’s Infrared Port Serial Connector Figure 15: Aligning the GX-2003 with the Cable Infrared Receiver 3. Press and hold the POWER/ENTER button on the GX-2003 until you hear a beep, then release it. The GX-2003 will begin it’s power up sequence with the pump turning on.
• To download all data and instrument information from the instrument, click Complete Download. • To download instrument information only, click Instrument Information. • To download interval trend data only, click Interval Download. • To download alarm trend data only, click Alarm Trend. • To download alarm events only, click Alarm Events. • To download trouble events only, click Trouble Events. Figure 17: Download Commands 6.
7. If the unit has been downloaded manually (Automatic Download not selected) using the Complete Download or Instrument Information commands, the unit’s instrument information may be viewed after downloading by using the Instrument Information button if the unit is still turned on and connected to the computer. The instrument information includes instrument parameters such as serial number and alarm points, and also includes the results of the most recent successful calibration for each channel.
8. You can view, print, export, or delete downloaded data by entering the Data or Last Calibration windows. These windows are accessed by clicking the Data or Last Calibration buttons along the right side of the Download window. See “Viewing, Printing, Exporting, and Deleting Data” on page 32 or “Last Calibration Button” on page 18. 9. After downloading data from an instrument, you can delete all the data in the GX-2003 by clicking the “Clear Data” button if desired.
Viewing, Printing, Exporting, and Deleting Data The GX-2003 logs four types of data files: calibration history, interval trend data, alarm trend data, and event data. You can view, print, and export (save to a file) each of these types of data files. All of these types of data files can also be deleted. The deleting of files is password protected and is described in “Deleting Data” on page 53.
Double-click to show data folders Click to expand folder Click to show interval trend files Interval trend files Figure 20: Data Window, Basic Data Organization The Data window is divided into four frames. The upper left frame is the Data frame and displays all the data folders. They are grouped under the GX-2003 icon in the upper left part of the frame. If the data folders are not visible, double click the icon to make them visible.
selected in the Data frame. The lower right frame shows the summary information for a data file that is selected in the upper right frame. The View Data control button is located at the bottom of the lower right frame. The View Data button becomes active when a data file is selected in the upper right frame. Clicking the View Data button opens the data file and displays the data. Calibration History Instrument calibration history is available in two separate locations in the program.
Double-click to show data folders Click to expand folder Click to show Cal. Histories File Cal. Histories file Figure 21: Data Window - Selecting Calibration History Files 2. If necessary, double-click the GX-2003 icon in the top of the Data window’s upper left frame to see the folders of downloaded data. 3. Find your instrument by serial number, then click the expanded view symbol (+) or double-click the folder to view the contents.The top folder is untitled and contains the Calibration History folder.
be shown in the bottom right frame along with the total number of calibrations saved if it is more than two. 7. To view the Calibration Histories file in table format, double click the Calibration Histories file or click the View Data button. Calibration Histories files can only be viewed in table format. Figure 22: Data View - Calibration History 8. If you want to print the data, click the Print button. A Print dialog box will appear for you to select a printer. 9.
Figure 23: Save as Dialog Box After specifying the, file name, file location, and file type click the Save button to save the file to the specified location. 10.To save the table to the clipboard, click the To clipboard button and the table will be saved to the clipboard. It can then be pasted into a document by using the Paste command in an application. 11.To go back and view other data, click the Data button on the right side of the program window and select the data you want to view.
The data may be viewed either in table format or graph format if at least 5 scheduled data points have been logged at the programmed interval. If an interval data file has fewer than five scheduled data points, the data cannot be graphed. To view and perform desired operations with the interval trend files: 1. With the software already launched, click the Data control button along the right side of the program window. The Data window will appear.
4. Click the expanded view symbol (+) of or double-click the dated folder whose contents you want to see. 5. Click on the Interval Trend folder. In the upper right frame of the Data window, a list of file names will appear in the Name column. A prefix of “iv” indicates an interval trend data file. 6. Click one of the interval trend data file names. A summary will appear in the bottom right frame with instrument and alarm setting information.
average gas readings over the user defined interval. So if the data logging session started at 4:13:38 PM and the interval time is set to 1 minute, then the readings logged at 4:14:38 PM are the average reading for each channel over that one minute period. • Events are displayed on the screen under the channel in which they occur and with the time of the event. Events are displayed whether they occurred at scheduled log times or in between them.
• If you click the Summary button, the data window will split into two frames, one above the other, with the data table in the lower frame and the summary information shown in the upper frame. The summary information is the same as the one shown in the lower right frame in Figure 24. 8. If data is being viewed from an instrument that included a TC %volume CH4 sensor, then it is possible that readings above 100% LEL were logged for the CH4 channel.
Zoom level Cursor feature Figure 27: Interval Trend Data in Graph Format When viewing interval trend data in graph format, you have several options: • You can choose which gas you want to graph • You can choose the zoom level, or displayed time interval, on the graph. The zoom feature shows greater detail relative to time. Thus, the length of a time division on the graph will depend on both the length of the datalogging session and on the zoom factor.
• If you click the Summary button, the data window will split into two frames one above the other with the graph in the lower frame and the summary information shown in the upper frame. The summary information is the same as the information shown in the lower right frame in Figure 24. 10.To print the data, whether it is viewed in table or graph format, click the Print button. A Print dialog box will appear for you to select a printer.
12.To save the table or graph to the Clipboard, click the To clipboard button and the table or graph will be saved to the Clipboard. It can then be pasted into a document by using the Paste command in an application. 13.To go back and view other data, click the Data button on the right side of the program window and select the data you want to view.
To view and perform desired operations with the alarm trend files: 1. With the software already launched, click the Data control button along the right side of the program window. The Data window will appear. 2. If necessary, double-click the GX-2003 icon in the top of the Data window’s upper left frame to see the folders of downloaded data.
appear in the Name column. A prefix of “al” indicates an alarm trend data file. 6. Click one of the alarm trend data file names. A summary will appear in the bottom right frame with instrument and alarm setting information. If you want to view, graph, print, or export the alarm trend data, double-click the filename or click the View Data button at the bottom of the window. 7.
• The gas readings at the time of the alarm event around which the logged data are centered are highlighted in red and are the instantaneous readings at that time. • If you click the Summary button, the data window will split into two frames one above the other with the data table in the lower frame and the summary information shown in the upper frame. The summary information is the same as the information shown in the lower right frame in Figure 29. 8.
Alarm event and gas concentration Zoom factor Cursor feature Figure 32: Alarm Trend Data in Graph Format When viewing alarm trend data in graph format, you have all the same options as when viewing interval trend data. See instruction 9 on page 41 in “Interval Trend Data”. 10.To print the data, whether it is viewed in table or graph format, click the Print button. A Print dialog box will appear for you to select a printer.
to specify the filename, file location, and file type. Figure 33: Save as Dialog Box For Graph view the export file type is Windows bitmap (.bmp). For Table view the default file type is “.csv” (commaseparated values.) After specifying the, file name, file location, and file type click the Save button to save the file to the specified location. 12.To save the table or graph to the clipboard, click the To clipboard button and the table or graph will be saved to the clipboard.
Event Data The GX-2003 not only saves trend files which include logged data at scheduled times, but also saves the 100 most recent alarm events and the 100 most recent trouble events. When an instrument is downloaded, the GX-2003 Data Logging Software will retrieve these events from an instrument and save them in alarm event files and trouble event files for each instrument that is downloaded.
2. If necessary, double-click the GX-2003 icon in the top of the Data window’s upper left frame to see the folders of downloaded data. 3. Find your instrument by serial number, then click the expanded view symbol (+) or double-click the folder to view the contents.The top folder is untitled and contains the Calibration History folder. The rest of the folders contain folders for the interval trend files, alarm trend files, and event files and are named and organized by date (month/year). 4.
Figure 36: Data View - Trouble Events 7. If you want to print the data, click the Print button. A Print dialog box will appear for you to select a printer. 8. To export the data to another application, for example a spreadsheet or database, click the Export button. A “Save As” dialog box will appear for you to specify the filename, file location. The default file type is “.csv” (comma-separated values.
After specifying the, file name, file location, and file type click the Save button to save the file to the specified location. 9. To save the table to the Clipboard, click the To clipboard button and the table will be saved to the Clipboard. It can then be pasted into a document by using the Paste command in an application. 10.To go back and view other data, click the Data button on the right side of the program window and select the data you want to view.
To delete calibration data in the Last Calibration window: 1. With the software launched, click the Last Calibration button on the right side of the program window. The Last Calibration window will appear. 2. Select the Need Calibration or Calibration Date option. 3. Click the row for the instrument whose calibration information you want to delete to select it. It will be highlighted to show that it is selected. 4. Click the row with the right mouse button. The Print/Delete window appears. 5.
6. Type the new password again, then click the Confirm New Password button. 7. Click OK when the program confirms that you have changed the password. 8. Close the Password window.
Calibrating A GX-2003 With the Data Logging Software A GX-2003 can be calibrated using the GX-2003 Data Logging Software. The calibration function is available in the Set window. To perform a calibration you will need a calibration kit. This section describes calibration using a calibration kit that includes a demand flow regulator.
To calibrate a GX-2003, perform the following steps: 1. Launch the GX-2003 Data Logging Software. 2. .Connect a GX-2003 to the software. See “Downloading Data from the GX-2003” on page 27, instruction 1 through instruction 3, for instructions to connect an instrument to the software. 3. Once the connection is made, the Complete Download, Instrument Information, and Power Off download commands will be selectable.
Click boxes to select channels for calibration Set Auto Cal. values to match gas cylinder Figure 39: Set Window with Calibration Frame 6. Use the selection boxes under the Span column to select the channels you want to calibrate. NOTE: If installed, the TC % volume sensor cannot be calibrated at the same time as the other sensors because a multi-gas cylinder that includes % volume methane is not available. 7. Click the Zero button.
8. Verify that the value(s) in the Auto Cal. column match the gas concentration(s) in the calibration cylinder that will be used. If not, place the cursor in the field that needs to be changed and update the value. If you have a GX-2003 with the TC % volume sensor, the CH4 at the top of the list is the %LEL sensor and the CH4 at the bottom of the list is the TC sensor. 9. Screw the demand flow regulator onto the calibration cylinder. 10.
Changing Data Logging Parameters To make changes to parameters stored in the GX-2003, use the Set window of the GX-2003 Data Logging Software. Follow the steps below to make these changes. 1. Launch the GX-2003 Data Logging Software. 2. .Connect a GX-2003 to the software. See “Downloading Data from the GX-2003” on page 27, instruction 1 through instruction 3, to connect an instrument to the software. 3.
5. To change the serial number, station ID, or user ID stored in the GX-2003, click the field you wish to change (e.g., user ID), use the backspace key to remove the current entry, then type the new information. 6. To change the datalogging interval time, click on the down arrow in the Interval Trend Time field and select the desired interval time in seconds. 7. To change the channel parameters, click the field you wish to change (e.g. H2S AutoCal.
Changing the Appearance of the Software Screens To change how information is displayed in the software (e.g., text fonts and graph colors), use the Set window of the GX-2003 Data Logging Software. Follow the steps below to make these changes. 1. Launch the GX-2003 Data Logging Software. 2. Click the Set button to display the Set window. Use the Font And Color frame in the left side of the window to change fonts and graph colors.
Figure 42: Font Window 4. Select the colors used to graph the various target gases in the interval and alarm trend files. To do this, click the appropriate Graph Color button on the left side of the Set window in the Font and Color frame. Figure 43: Color and Custom Color Windows 5. After making the desired changes, click OK. 6. The changes you have made will take effect after you exit and restart the Data Logging Software.
Spare Parts List Table 1: Spare Parts List Part Number Description 47-5026RK Cable, serial/IrDA adapter 49-5027RK Cable, USB/IrDA adapter 71-0096RK GX-2003 Data Logging Software Operator’s Manual (this document) 83-0007RK Downloading software, GX-2003 Spare Parts List • 64