
Instruction Manual

30 • Viewin
g,
Printin
g,
Ex
p
ortin
g,
and Deletin
g
Data
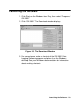
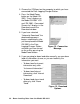
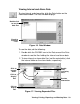
3. Next double-click a file to view its contents, or click the View
Data button.
4. When viewing interval data, you can see the information in a
table format, graph the data if there are more than five
scheduled data points, view the data in summary form, or
view the events only. Data that has been graphed shows log
time, gas concentration levels, and alarm events.
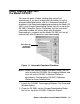
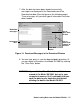
Figure 18. Interval Data Displayed
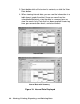
Interval Data
Interval Data with Summary