
Instruction Manual

Overview of the GX-2001 Data Lo
gg
in
g
Software • 11
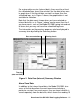
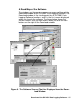
For a given data session (interval data), there must be at least
five scheduled logs (every five minutes) for the data to be seen
in graph form. If an interval data session has fewer than five
scheduled logs, as in Figure 1 above, the graph button is not
available for selection.
Note that the data count shown when you have selected an
interval data file, as in Figure 1 above, can be more than five if
you have events, such as the Model GX-2001 going into and out
of alarm, but you may not have five scheduled log times.
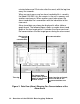
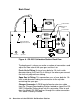
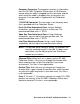
The information on the previous page can also be displayed in
summary form by clicking the Summary button.
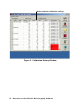
Alarm Trend Data
In addition to the interval trend data, the Model GX-2001 also
saves a file that describes the most recent event during a
particular session.If an event occurs, then an alarm trend file is
saved separately from the data file, which shows the reading 15
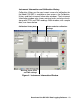
Figure 2. Data View (Interval) Summary Window
Gas concentrations
Warning levels
Time log
(date and time)