Data Cal 2000 Operator’s Manual Part Number: 71-0097RK Revision: D Released: 11/3/11 RKI Instruments, Inc.
Warranty RKI Instruments, Inc. warrants gas alarm equipment sold by us to be free from defects in materials and workmanship, and performance for a period of one year from date of shipment from RKI Instruments, Inc. Any parts found defective within that period will be repaired or replaced, at our option, free of charge.
Table of Contents Introduction . . . . . . . . . . . . . . . . . . . . . . . . . . . . . . . . . . . . . . . . . . . . . . . 1 System Requirements . . . . . . . . . . . . . . . . . . . . . . . . . . . . . . . . . . . . . . . 2 Specifications . . . . . . . . . . . . . . . . . . . . . . . . . . . . . . . . . . . . . . . . . . . . . . 3 Description . . . . . . . . . . . . . . . . . . . . . . . . . . . . . . . . . . . . . . . . . . . . . . . . 4 Docking Station . . . . . . . . . . . . . . . . . . . . . . . . .
Setting Up the Data Cal 2000 Software . . . . . . . . . . . . . . . . . . . . . . . . 27 Setting Up the Configuration . . . . . . . . . . . . . . . . . . . . . . . . . . . . . . 28 Viewing the Pre-Defined Cylinders . . . . . . . . . . . . . . . . . . . . . . . . . 32 Adding and Updating Cylinders . . . . . . . . . . . . . . . . . . . . . . . . . . . 33 Setting Up the Solenoids . . . . . . . . . . . . . . . . . . . . . . . . . . . . . . . . 36 Connecting Instruments to the Data Cal 2000 . . . . . . . . . . .
Power Off Function . . . . . . . . . . . . . . . . . . . . . . . . . . . . . . . . . . . . . 77 Configuration Window . . . . . . . . . . . . . . . . . . . . . . . . . . . . . . . . . . . . . . 77 Parameter Tab . . . . . . . . . . . . . . . . . . . . . . . . . . . . . . . . . . . . . . . . 78 Database Tab . . . . . . . . . . . . . . . . . . . . . . . . . . . . . . . . . . . . . . . . . 79 Sensor Tab . . . . . . . . . . . . . . . . . . . . . . . . . . . . . . . . . . . . . . . . . . . 80 Password Tab . . . .
Introduction The Data Cal 2000 Docking Station is a comprehensive and reliable system that provides charging, data downloading, configuration updating, calibration, and bump testing for the GX-2001, GX-2003, and GX-2009 gas detectors. It is designed for use with a Windows-based PC and the Data Cal 2000 Docking Station Software. The purpose of this manual is to explain how to set up and use the Data Cal 2000 Docking Station and the Data Cal 2000 Docking Station Software.
CAUTION: The operator of this instrument is advised that if the equipment is used in a manner not specified in this manual, the protection provided by the equipment may be impaired. System Requirements To use the Data Cal 2000 and the Data Cal 2000 Docking Station Software, your personal computer must meet the following requirements: • Operating Systems: Windows® 98, Windows® ME, Windows® 2000, Windows NT® 4.0, or Windows® XP.
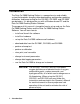
Specifications Table 1: Data Cal 2000 Specifications Input Power 115 VAC, 50/60 Hz Environmental Conditions • For Indoor Use Only • -10° C to 40° C, below 80% Relative Humidity, NonCondensing Number of Docking Modules Up to 10 docking modules Applicable Instruments • GX-2001 • GX-2003 • GX-2009 Number of Calibration Gas Cylinders Up to 5 calibration gas cylinders and one zero air cylinder 3 • Specifications
Description The Data Cal 2000 consists of the following components: • Data Cal 2000 Docking Station • DM-2001 Docking Module for GX-2001 • DM-2003 Docking Module for GX-2003 • DM-2009 Docking Module for GX-2009 • RS-232C serial communication cable for connection of the docking station to a computer • RS-485 serial communication cables for connection of the docking station to a docking module and for daisy chain connection of additional docking modules to each other • Power cord • A 4-gas mix calibration cyl
Docking Station The docking station manages the calibration, bump test, and information exchange functions of the Data Cal 2000 once they have been initiated through the software.The status LED’s are on the front panel. The power switch and hose barb fittings for connection of calibration gas cylinders and routing of calibration gas to the docking modules are located on the back panel.
Back Panel Fan Grill MODULE POWER PC(RS-232C) AIR GAS1 GAS2 GAS3 GAS4 GAS5 FUSE(5A) AC IN AC100V-AC240V GAS OUT Figure 3: Data Cal 2000 Back Panel The power switch is a rocker switch and is located in the upper right corner of the back panel. The docking station is on when the upper half of the switch, the “1” position, is pressed in, and off when the lower half of the switch, the “0” position, is pressed in. All the gas fittings are located on the back panel.
recessed plug in the lower right corner of the panel is used to connect an AC line cord. It is labeled AC IN. A fuse holder is located to the left of the AC IN connector. It is labeled FUSE(5A). The fuse holder consists of a panel mounting socket and a quarter turn fuse holder. The fuse is a 5 amp, 5 mm x 20 mm fuse. A cooling fan is located inside the docking station on the right side above the fuse holder.
Exhaust Fittings Calibration Gas Fittings ID Switch Terminator Switch Connector for Cable From Other Docking Module Connector for Cable from Data Cal 2000 or Other Docking Module Figure 5: Back of DM-2001 and DM-2003 Docking Module Calibration Gas Fittings Exhaust Fitting ID Switch Terminator Switch Connector for Cable From Other Docking Module Connector for Cable From Data Cal 2000 or Other Docking Module Figure 6: Back of DM-2009 Docking Module Two DB-15 connectors on the back of each module allow
module is the last one in the flow system, it is plugged with a push-on plug that is supplied with the docking station. A two port exhaust routing fitting is located in the upper right corner of the back of the DM-2001 and DM-2003 modules. It allows routing of the exhausted calibration gas from all DM-2001 or DM-2003 modules to the last module so the exhaust gas can be safely routed to a convenient exhaust location. The DM-2009 module has only one exhaust fitting.
DM-2001 Docking Module The GX-2001 fits into the DM-2001 module as shown in Figure 7 below. The module includes a snap-on sample adapter for the GX-2001. The exhaust port of the adapter is connected to a port on the front left of the module by a short tube and the adapter’s inlet port is connected to a port on the top rear of the module by a coiled tube. The sample adapter snaps onto the sensor side of the GX-2001 before the GX-2001 is installed into the module.
DM-2003 Docking Module The GX-2003 fits into the module as shown in Figure 8 below. A coiled black tube with a plastic push-on fitting resides in a recess in the left rear corner of the top of the module. The coiled tube routes gas to the GX-2003 and extends to connect to the GX-2003’s inlet fitting. A straight green tube comes out of the top of the module to the right of the coiled tube and also has a plastic push-on fitting on its end.
DM-2009 Docking Module The GX-2009 fits into the module as shown in Figure 9 below. IR Port Instrument Retaining Tab Instrument Cradle Charging Contacts POWER CHAR GE CAL. POWER CHAR GE CAL. DM-2009 DM-2009 Figure 9: DM-2009 Docking Module Communication Cables The number of communication cables needed depends on how many docking modules are used.
Power Cord A three-pronged AC power cord is provided with the Data Cal 2000. One end connects to a standard AC wall outlet and the other end plugs into the AC power socket on the back of the docking station. 4-Gas Mix Calibration Cylinder The Data Cal 2000 may be ordered with or without calibration gas and a demand flow regulator. The standard configuration of the Data Cal 2000 includes a demand flow regulator and one 58 liter 4-gas mix calibration cylinder which typically contains 50% LEL CH4/12.
Setting the Docking Module Configuration Switches The docking module configuration switches determine module ID and the order in which the modules are physically installed. Before using the Data Cal 2000, you will need to set the configuration switches as described below. If you are adding a module or modules to a system that is already setup, make sure the system is setup as described below after the new module or modules are added.
Termination Switch The termination switch is located above the left DB-15 connector on the back of the docking module. It is a two position slide switch. The switch position indicates whether the module is physically the last module in the installation or not. When the Data Cal 2000 is viewed from the front, the last module in the installation is the module on the far right and it must have the termination switch set to the down position for the Data Cal 2000 to operate properly.
3. Place the docking station on the flat surface with enough room to the right of the docking station (when viewed from the front) to fit all of the docking modules side by side. 4. Place the first docking module to the right of the docking station and line up the three tabs on the left side of the module with the three recesses on the right side of the docking station. 5. Push the module toward the docking station so the tabs mate with the recesses and the module is flush against the docking station.
used in your system, cable installation is done. If more modules are used in you system, continue with step 4. 4. Install a RS-485 cable between each adjacent module from the left connector of one module to the right connector of the next module. The module on the end will not have anything connected to the left connector. Tubing Installation Module CAL. GAS Fitting Connections Tubing Install plug on last CAL. GAS fitting.
3. Repeat step 2 for each successive module in the system until you get to the last module. 4. Install the black fitting plug on the left CAL. GAS fitting of the last module in the system. Module Exhaust Fitting Connections GX-2001 and/or GX-2003 Install plug over fitting. Route to open area where calibration gas can be exhausted. Tubing, User Supplied Tubing,Supplied with System MODULE PC(RS-232C) AIR GAS1 GAS2 GAS OUT Figure 13: Exhaust Fitting Connections 1.
CAUTION: The maximum recommended length for the exhaust tube is 10 feet. Do not use more than 10 feet of tubing for the exhaust tube or bump test and calibration accuracy will be adversely affected. The tube that is shipped with the Docking Station is 10 feet long. GX-2009 MODULE Tubing, User Supplied PPC (RS-232C) Route to open area where calibration gas can be exhausted.
Docking Station Calibration Gas Fitting Connections The calibration gas fittings on the back panel of the docking station are designed to be used with calibration gas cylinders that are fitted with demand flow regulators. The AIR fitting may be used with a demand flow regulator and a cylinder of zero emissions air, but this is not normally necessary since the docking station will generally be in a fresh air area.
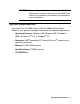
Table 2: Recommended Gas Cylinders Typical Instrument Types Recommended Calibration Gas Cylinder(s) GX-2009 LEL/Oxy/H2S/CO 4-gas mix with CH4/Oxy/H2S/CO GX-2009 LEL/Oxy/CO 3-gas mix with CH4/Oxy/CO GX-2009 LEL/Oxy/H2S 4-gas mix with CH4/Oxy/H2S/CO 1. If the area around the calibration station is not considered a fresh air area, an area free of combustible and toxic gases and of normal oxygen content, 20.
5. Read the license agreement and click the agreement acceptance selection box, then click Next to proceed to the Customer Information window. 6. Enter a user name and organization, then click Next to proceed to the Destination Folder window. 7. The default installation folder (C:\Program Files\Docking Station\) is displayed. If you want to install the software in the default folder continue with step 8.
Launching the Data Cal 2000 Software 1. Click Start on the Windows® Icon Tray, then select Programs/ Docking Station. The Data Cal 2000 program is launched and the docking station main program window appears. Figure 15: Data Cal 2000 Main Window NOTE: You can also start the software by double clicking on the Docking Station shortcut that the installation CD puts on the Windows® Desktop or in the Start menu. 2.
Cal 2000 Software". If you have already performed the software setup, proceed to “Connecting Instruments to the Data Cal 2000” on page 38. Overview of the Data Cal 2000 Software This section provides a brief overview of the software and a description of the main program window. Instructions for using the software are given in other parts of this manual.
• Instrument calibration controlled by the Calibration button Main Program Window The main program window is where the current status of the software operation is shown. Any docking modules and instruments that are connected to it and any instruments that have been but are not currently connected to it are also shown. The program’s various functions are initiated or accessed from this screen. The current date and time are always displayed in the lower right corner of the main window.
Docking Module/Instrument Display Area The large middle portion of the main window displays docking modules and instruments that are currently connected to the Data Cal 2000 and instruments that are in the database. The docking modules are identified by a number that corresponds to the ID switch setting on the back of the docking module. The instruments are identified by their serial number.
• Orange indicates that the corresponding cylinder will expire in less than 10 days. When the solenoid is activated, the indicator’s color will change to green while it is activated and then return to orange when the solenoid is deactivated. • Red indicates that the corresponding cylinder’s expiration date has passed. Although the software will allow use of the cylinder if it is expired, it is recommended that the expired cylinder be changed as soon as possible.
Setting Up the Configuration 1. Launch the software as described in “Launching the Data Cal 2000 Software” on page 23. NOTE: It is not necessary to turn on the Data Cal 2000 if you are only performing configuration setup. With the Data Cal 2000 off, the software will indicate communication errors in the area below the docking module/instrument display area. This is normal if the Data Cal 2000 is not turned on. 2. From the main window, click on the Config button located along the top of the window. 3.
4. Select the communication port that will be used in the Communication section. This is typically COM1 or COM2. Be sure that the port that is selected is not already being used by some other device. 5. Select the docking modules that are installed in the Docking Module section. Ten selection boxes are displayed with the IDs 0 through 9. The IDs on the selection boxes correspond with the IDs on the docking modules set by the ID switch (See “ID Switch” on page 14).
3600 seconds (1 hour). 8. Select the datalogging options in the Data Logger section. • If Down Load Data Logger is selected, the software will automatically download all data from an instrument when it is connected to the Data Cal 2000 if it is due for download. The Down Load interval value (see below) determines if an instrument is due. If Down Load Data Logger and Clear After Down Load are selected, then all logged data in a downloaded instrument will be cleared after it is downloaded.
to 90 seconds • Set the bump test tolerance for each channel. This option for each channel allows you to set up the criteria for determining if an instrument passes a bump test. The default value for each channel for the allowable deviation for a bump test is 30% of the gas concentration used in the test. These values are adjustable from 20% to 50%. If the result of the bump test for a channel is within the set deviation, then the channel passes the bump test.
Viewing the Pre-Defined Cylinders 1. From the main program window, click the Cylinders button located along the top of the window. The Cylinders window appears. The Cylinders window lists defined cylinders and has four function buttons in the lower right corner of the window for adding, updating, or deleting cylinders. When the software is first loaded, there are two pre-defined cylinders on the list.
Adding and Updating Cylinders Add a cylinder if the correct cylinder for your bump testing and calibration needs is not on the cylinder list. For example, you may have GX-2001’s that are LEL/Oxy/CO and so do not need to use a 4-gas mix that includes H2S. In this case you would add a 3-gas cylinder to the cylinder list with the appropriate gas concentrations. When you begin using a new cylinder that is already on the cylinder list, you will need to update the expiration date of the new cylinder.
Adding a Cylinder to the Cylinder List 1. From the Cylinders window, click the New button. The CylinderDetail window will appear. Figure 19: CylinderDetail Window, Adding a Cylinder 2. Put the cursor in the Name field and enter the cylinder name. 3. Click on the drop down box in the Pre-define Cylinder field and select the blank option. The Symbol (Unit), Gas Name, and Concentration fields become active. 4. Click in the top Symbol(Unit) field. A drop down box will appear. 5.
7. For each additional gas in the cylinder being entered move to the next Symbol(Unit) field and repeat steps 4 - 6. 8. If the cylinder will be used for bump testing, click in the Bump test selection box to place a check in it. 9. If the cylinder will be used for calibrating, click in the Calibration selection box to place a check in it. 10. Click the OK button. A confirmation window appears. 11. Click Yes to save the new cylinder’s settings and return to the Cylinders window. 12.
3. Update the cylinder parameters as desired. 4. Click the OK button. A confirmation window appears. 5. Click Yes to save the changes and return to the Cylinders window. 6. Click the Close button to return to the main window. Setting Up the Solenoids The solenoids are located inside the Data Cal 2000 docking station. They control which fitting on the back of the docking station is used to draw gas from a connected cylinder during a bump test or calibration.
• The GAS 1 solenoid which controls the Gas 1 fitting is assigned to Cylinder 0001 which is RKI 4-gas mix 81-00154RK-02. • The GAS 2 solenoid which controls the Gas 2 fitting is assigned to Cylinder 0002 which is RKI 50% volume CH4 cylinder 81-0013RK05. • Solenoids GAS 3, GAS 4, and GAS 5 are unassigned. If you define additional cylinders and wish to assign them to unassigned solenoids or wish to change the solenoid assignments: 1.
Connecting Instruments to the Data Cal 2000 When an instrument is connected to the Data Cal 2000, the software automatically retrieves the instrument’s parameters such as serial number, calibration interval setting, and data logging interval time. It can also automatically download data, bump test, or calibrate an instrument depending on whether these items are selected in the parameter tab of the Configuration window.
NOTE:As soon as a DM-2003 docking module recognizes that a GX-2003 is installed, a solenoid in the DM-2003 that allows the GX-2003 to draw gas is opened. If a GX-2003 is installed in the docking module when the Data Cal 2000 is turned on, it takes the DM-2003 about 5 seconds after turn on to recognize the GX-2003. The solenoid remains open for 3 minutes and is then closed. Turn on all GX-2003’s after this 5 second period and within 3 minutes of the solenoid being opened.
• A GX-2003 will begin its normal startup sequence and after a few seconds, the pump will turn off and the display will indicate it is ready to communicate with the computer: PC TRANSMIT STAND BY OK 21:09 • A GX-2001 will begin its normal startup sequence and after a second or two the display will indicate the following: Conn 7.
Figure 22: Instruments Connected to Data Cal 2000 8. Once all instruments are connected and all automatic functions are completed, the instruments are available for bump testing, calibration, data downloading, or parameter updates.
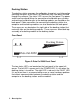
Bump Testing Instruments The Data Cal 2000 is capable of performing a bump test both manually and automatically when an instrument is connected to it. When a bump test is performed, the Data Cal 2000 performs an air adjust operation on an instrument and then applies calibration gas to the instrument. The Data Cal 2000 analyzes the response results based on predefined criteria and determines if the instrument passed the bump test.
3. Click the Bump test button. The Data Cal 2000 will initiate a bump test. During the bump test, the Data Cal 2000 will perform the following functions: • It will apply fresh air to the instrument for 45 seconds. • It will perform a zero operation on the instrument. • It will apply the necessary calibration gas to the unit for the number of seconds defined in the Gas Exposure Time setting in the Parameter Tab of the Configuration Window (see instruction 9 on page 30).
If the instrument or instruments failed the bump test, then the following indication is given. Figure 24Bump Test Fail Indication 5. If the Force Calibration box is checked, then the Data Cal 2000 will automatically calibrate any instrument or instruments that failed the bump test. 6. To close the result window, click the OK button.
Calibrating Instruments The Data Cal 2000 is capable of performing a calibration both manually and automatically on an instrument connected to it. When a calibration is performed, the Data Cal 2000 performs an air adjust operation on an instrument and then applies calibration gas to the instrument. The Data Cal 2000 analyzes the calibration results and determines if the instrument passed the calibration. To perform a manual calibration on an instrument that is connected to the software: 1.
4. When the calibration is completed, the software will analyze the results and display the Calibration & Bump test Result window which shows the calibration results. If the instrument or instruments passed the calibration then the following indication is given.
If the instrument or instruments failed the calibration, then the following indication is given. Figure 26: Calibration Fail Indication 5. To close the result window, click the OK button. For a failed calibration, if you want to view the test results for each channel, double click on an instrument in the result window and the software will take you to the Calibration area of the Logs window where the data for this calibration is saved. 6.
Deleting Instruments From the Main Window An instrument, along with all its associated data, can be deleted from the database from the main program window. This function is password protected to prevent accidental deletion of an instrument from the database. To delete an instrument from the database from the main program window, perform the following: 1. From the main program window, click on the instrument you want to delete so that it is highlighted. 2. Press the “Delete” key on the keyboard.
2. The LED on the left front of the docking module will turn off. The LED on the right front of the module will start blinking yellow. 3. If the battery pack is fully charged, then the blinking yellow LED will turn solid green in a few minutes. If the battery pack is drained enough for the module to charge it, the right LED will continue to blink yellow while charging is taking place.
NOTE: If the GX-2009 is left in the DM-2009 for a long period of time, the dock pump will run for 12 seconds every 2 minutes in order to keep excess hydrogen generated from the NiMH batteries from affecting the CO sensor. Logs Window Viewing Data You can view alarm trend data, calibration data, event data, interval trend data, memos, and bump test information in the Logs window. To enter the Logs window, click the Logs button from the main program window.
2. ID View Format The data can be organized by one or more of the following items depending on which selection box or boxes in the lower left of the window are selected: • Serial Number • Station ID • User ID If any of these boxes is selected, the Base box disappears. Figure 28: Logs Window in ID Viewing Format Once you have selected how you want to organize the data: 1.
Logs window. If an item is expanded and you want to close it, click the (-) symbol next to the item or double click it. 2. When a folder no longer has a (+) or (-) symbol next to it, single click it and the contents of the folder will be shown on the right side of the Logs window. The various types of data and information are described below. Deleting Data You can delete an instrument, alarm trend data, calibration data, event data, interval trend data, and bump test information in the Logs window.
before an alarm event or is not on for 15 minutes after the alarm event, only the time that the unit was on is shown in the alarm trend file. If a GX-2003 or the GX-2009 has not been on for 30 minutes before the alarm event or is not on for 30 minutes after the alarm event, only the time that the unit was on is shown in the alarm trend file.
Figure 29: Alarm Trend Files in Base View Format If you organize the data by date, then folders organized by year/ month appear in the left side of the window. Expand the folder you want to see and click on the Alarm folder. The alarm trend files will appear in the upper right side of the window. If you are viewing data in ID view format, expand folders in the left side of the window until the Alarm folder you wish to view is visible. Expand the Alarm folder.
Figure 30: Alarm Trend Files in ID View Format 3. To view summary information about the alarm file, select it in the right side of the window. A summary of the file will appear in the area below the file list. 4. To open the file and see the data and a graph of the data, double click on the file. The Data Sample (Alarm Trend) window will appear with a table of the data on the left side of the window and a graph of the data on the right side.
Figure 31: Alarm Trend File Data & Graph 5. You can choose to view the data in a variety of arrangements, such as data on the left and graph on the right, by clicking the appropriate Data Arrangement button in the upper left of the window. Each Data Arrangement button has a table and graph symbol inside of it. 6.
selected, the data will print as a table. 8. To save the data to a file which can be imported into another program, select either List or Graph in the upper right corner of the window and then click the Save To File button. The Save To File button has a floppy disk icon in it. A “Save As” dialog box will appear for you to specify the filename, file location, and file type. Figure 32: Save As Dialog Box If Graph is selected, the file type is Windows bitmap (.bmp). If List is selected, the file type is “.
Calibration Data The GX-2003 saves the calibration information for the last 20 calibrations while the GX-2009 saves the calibration information for the last 100 calibrations. When an autocalibration is performed, the calibration results are saved as a file. When single calibration is used, the GX-2003 and GX-2009 consider each time you calibrate a channel a calibration and a file is saved for that calibration.
Figure 33: Calibration Files in Base View Format If you organize the data by date, then folders organized by year/ month appear in the left side of the window. Expand the folder you want to see and click on the Calibration folder. The calibration files will appear in the upper right side of the window. If you are viewing data in ID view format, expand the folders in the left side of the window until the Calibration folder you wish to view is visible. Expand the Calibration folder.
Figure 34: Calibration Files in ID View Format 3. Files that record a failed calibration on all channels are highlighted in red. Files that record a calibration where not all channels passed are highlighted in orange. 4. To view the file in summary format, click on the calibration file in the upper right part of the Logs window that you wish to view. The calibration information in the file will appear in the lower right part of the window in summary format.
Event Data The GX-2003 and the GX-2009 save events such as gas alarms, calibration failures, and sensor failures. These events are saved as files in the Logs window. The files indicate the instrument, time of the event, and event type. The Data Cal software does not save event data separately for GX-2001’s, but the events saved by a GX-2001 are viewable in the interval trend data. To view and perform desired operations with the event files: 1.
Expand the Event folder. Folders organized by year/month will be listed below the Event folder. Click the folder whose contents you want to view and the event files in it will be shown in the upper right side of the Logs window. Figure 36: Event Files in ID View Format 3. To print all the event files in the upper right window, click the Print button in the upper left corner of the Logs window. The Print button has a printer icon in it. A dialog box will appear confirming if you want to print. Click OK. 4.
be adjusted with the DataCal 2000 software in the Parameter Tab as described in “Setting Up the Configuration” on page 28. At the scheduled log time, the GX-2003 also saves the average readings of the previous interval period. The log time will depend on how many times the GX-2003 is turned on and off and how many events such as gas alarms occur.
Figure 37: Interval Trend Files in Base View Format If you organize the data by date, then folders organized by year/ month appear in the left side of the window. Expand the folder you want to see and click on the Interval folder. The interval trend files will appear in the upper right side of the window. If you are viewing data in ID view format, expand the folders in the left side of the window until the Interval folder you wish to view is visible. Expand the Interval folder.
Figure 38: Interval Trend Files in ID View Format 3. To view summary information about an interval trend file, select it in the right side of the window. A summary of the file will appear in the area below the file list. 4. To open the file and see the data and a graph of the data, double click on the file. The Data Sample (Interval Trend) window will appear with a table of the data on the left side of the window and a graph of the data on the right side.
Figure 39: Interval Trend File Data & Graph 5. You can choose to view the data in a variety of arrangements, such as data on the left and graph on the right, by clicking the appropriate Data Arrangement button in the upper left of the Logs window. Each Data Arrangement button has a table and graph symbol inside of it. 6.
Graph is selected, the data will print as a graph and if List is selected, the data will print as a table. 8. To save the data to a file which can be imported into another program, select either List or Graph in the upper right corner of the window and then click the Save To File button. The Save To File button has a floppy disk icon in it. A “Save As” dialog box will appear for you to specify the filename, file location, and file type.
Memo Feature Memos can be created in the Instrument Information window. See “Edit Function, Memo Entry” on page 75. Memos can be used to record information or comments about an instrument. To view and perform desired operations with the memo files: 1. While in the Logs window, open folders in the left side of the window until the Memo folder you wish to view is visible. 2. If you are viewing data in base view format with the data organized by type, expand the Memo folder.
If you are viewing data in ID view format, expand the files in the left side of the window until the Memo folder you wish to view is visible. Expand the Memo folder. Folders organized by year/month will be listed below the Memo folder. Click the folder whose contents you want to view and the memo files in it will be shown in the upper right side of the Logs window. Figure 42: Memo Files in ID View Format 3.
Bump Test Files The results of all bump tests performed by the Data Cal 2000 are saved in the Logs window. To view and perform desired operations with the bump test files: 1. While in the Logs window, open folders in the left side of the window until the Bump test folder you wish to view is visible. 2. If you are viewing data in base view format with the data organized by type, expand the Bump test folder. Folders organized by year/ month will appear below the Bump test folder.
month will be listed below the Bump test folder. Click the folder whose contents you want to view and the bump test files in it will be shown in the upper right side of the Logs window. Figure 44: Bump Test Files in ID View Format 3. Files that record a failed bump test on all channels are highlighted in red. Files that record a bump test where not all channels passed are highlighted in orange. 4.
Instrument/Module Function Menu When you are in the main program window, if you right click on an instrument or a docking module, the Instrument/Module Function menu appears. Figure 45: Instrument/Module Function Menu The functions in the Instrument/Module Function menu are Open, Edit, Download, Clear Logs, Reset, and Power Off.
Open Function This function can be activated by either right clicking an instrument and selecting Open(O) when the pull down menu appears or by selecting an instrument and then using the alt/O key combination. The Open function brings up the Instrument Information window for viewing only. No changes can be made with the Open function. The Instrument Information window consists of the Parameter Setting tab and the Sensor Setting tab.
mode (see below). Figure 47: Instrument Information Window, Sensor Setting Tab Edit Function This function can be activated by either right clicking an instrument that is connected to the Data Cal 2000 and selecting Edit(E) when the pull down menu appears or by selecting an instrument that is connected to the Data Cal 2000 and then using the alt/E key combination.
Load User Defaults buttons in the Sensor Setting tab. To change any of the items in either of the two tabs’ fields: 1. Put the cursor in the field you want to update and change the setting. Repeat this for any additional fields you want to update. To deactivate or activate a sensor, click in the right side of the desired sensor field and a pull-down arrow will appear as shown in Figure 47 (CH4 channel shown) which will allow you to select a gas name or “---”.
document. 3. Click the OK button in the lower right corner of the Instrument Information window. 4. A confirmation box will appear. Click the Yes button. 5. The software will save the memo in the instrument’s Memo folder in the Logs Window and return to the main program window.
NOTE: If communication errors for a module or improper operation of a module continue after resetting the module, verify that the terminator switch has been set properly in the down position for the last module in the system and that all the other modules have the terminator switch set to the up position.
2. Enter the password and click OK. The factory set password is “ABCDE” and is case sensitive. After clicking OK, the Configuration window appears. Figure 48: Configuration Window Parameter Tab See “Setting Up the Configuration” on page 28 for a description of the Parameter tab.
Database Tab 1. From the Configuration window, click on the Database tab to view it. Figure 49: Database Tab 2. To create a new database that is a copy of the existing one, click the Create button. A Save As dialog box will appear and prompt you for a file name. Enter the file name and click the Save button. 3. To import data into the database, click the Import button. An Open dialog box will appear and prompt you for the file name of the file you wish to import.
click the Remove selection box. When you have made all selections, click the Export button. A Save As dialog box will appear and prompt you for the file name. Enter the file name and click the Save button. 5. Click the OK button to return to the main program window. Sensor Tab Figure 50: Sensor Tab The values in the Factory Defaults window in the sensor tab cannot be changed. They include the alarm points, autocalibration concentrations, and zero follower settings.
Follower setting from the factory default settings. Do not change the Zero Follower settings. 4. To save any changes made in the User Defaults window, click the OK button and you will return to the main program window. To cancel any changes made in the User Defaults window, click the Cancel button and you will return to the main program window.
5. A confirmation window appears. Click the Yes button. You will return to the main program window. Optimizing the Database It is possible to optimize the database so that it requires a minimum amount of computer memory. To optimize the database, press the “F12” key while in the main program screen.
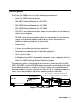
Table 3: Spare Parts List Part Number Description 81-DM2001 Docking module for GX-2001 81-DM2003 Docking module for GX-2003 81-DM2009 Docking module for GX-2009 83 • Spare Parts List