
User Guide Part 1


Wi-Fi Array
146 Viewing Status on the Wi-Fi Array
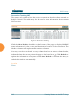
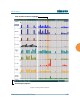
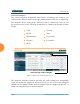
The Spectrum Analyzer offers several display options:
z
To display horizontal bar graphs, click the Rotate checkbox at the bottom
of the data window.
z
In the rotated view, if you wish to view data as a numerical table, click the
Te xt checkbox. Click again to return to a graphical display. The text
option is only available in the rotated view.
z
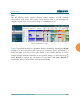
When viewing a graphical display, click Bars to have the bar graphs
displayed against a gray background—you may find this easier on the
eyes. This operation is not available when Text is selected.
z
You may sort the rows based on any column that has an active column
header, indicated when the mouse pointer changes to the hand icon .
Sorting is only available in the rotated view.
z
At the bottom left of the frame, you may select whether to display only
2.4 GHz channels, 5 GHz channels, or both (both is the default). Note that
the data is an instantaneous snapshot—it is not an average or a
cumulative total.
Spectrum Analyzer Measurements
The spectrum analyzer displays the following information:
z
Packets/Sec: Total number of Wi-Fi packets per second on the channel,
both valid and errored packets.
z
Bytes/Sec: Total number of Wi-Fi bytes per second on the channel, valid
packets only.
z
802.11 Busy: Percentage of time that 802.11 activity is seen on the channel.
z
Other Busy: Percentage of time that the channel is unavailable due to
non-802.11 activity.
The total busy time (802.11 Busy plus Other Busy) will never total more
than 100%. The remaining time (100% minus total busy time) is quiet
time—the time that no activity was seen on the channel.