
Overview of This Tutorial - Department of Geosciences


Tutorial: Hyperspectral Signatures and Spectral Resolution
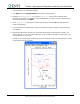
7. For easier comparison, select Edit → Data Parameters from the ENVI Plot Window menu bar, and
change the Mean:Kaolinite and Mean:Alunite colors to match the colors of the corresponding
library spectra.
Open Landsat TM Image
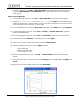
8. From the ENVI main menu bar, select File → Open Image File. A file selection dialog appears.
9. Navigate to envidata\cup_comp and select cuptm_rf.img. Click Open. This file contains Landsat
TM data for Cuprite with a spatial resolution of 30 m and a spectral resolution of up to 100 nm. These
public-domain data were acquired on 4 October 1984.
10. In the Available Bands List, select the Gray Scale radio button, select Band 6, and click Load Band.
11. From the Display group menu bar, select Tools → Profiles → Z Profile (Spectrum). A Spectral
Profile plot window appears.
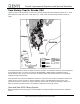
12. From the Display group menu bar, select Tools → Pixel Locator. A Pixel Locator dialog appears.
13. Enter the pixel location (248, 351), a kaolinite feature, and click Apply.
14. Right-click in the Spectral Profile plot window and select Collect Spectra.
15. Enter the following pixel locations and click Apply each time.
Alunite (260, 330)
Buddingtonite (202, 295)
Silica or Opal (251, 297)
16. From the Spectral Profile menu bar, select Edit → Plot Parameters. A Plot Parameters dialog
appears.
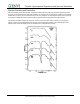
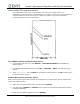
17. The X-Axis radio button is selected by default. Enter Range values from 2.0 to 2.5. Click Apply, then
Cancel.
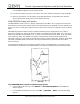
18. Right-click in the Spectral Profile window and select Stack Plots.
8
ENVI Tutorial: Hyperspectral Signatures and Spectral Resolution