
Overview of This Tutorial - Department of Geosciences
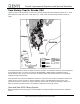

Tutorial: Hyperspectral Signatures and Spectral Resolution
View Landsat TM Image and Spectra
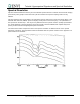
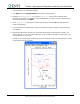
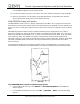
The following plot shows region of interest (ROI) mean spectra for kaolinite, alunite, and
buddingtonite. The small squares indicate the TM band 7 (2.21 µm) center point. The lines indicate the
slope from TM band 5 (1.65 µm). The spectra appear very similar, and you cannot effectively
discriminate between the three endmembers.
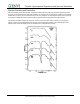
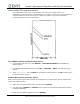
View TM Mean Kaolinite and Alunite Image Spectra
1. From the ENVI main menu bar, select Window → Start New Plot Window. A blank ENVI Plot
Window appears.
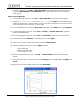
2. From the ENVI Plot Window menu bar, select File → Input Data → ASCII. A file selection dialog
appears.
3. Select cuptm_em.txt and click Open. An Input ASCII File dialog appears. Click OK to plot the mean
kaolinite and alunite spectra.
Compare Mean Spectra and Library Spectra
Refer to these steps throughout the rest of the tutorial whenever you compare library spectra and ROI mean
spectra from different sensors.
4. Right-click in the Spectral Library Plots window and select Plot Key.
5. Click and drag the Kaolinite and Alunite spectrum names from the Spectral Library Plots window to
the ENVI Plot Window.
6. Right-click in the ENVI Plot Window and select Plot Key.
7
ENVI Tutorial: Hyperspectral Signatures and Spectral Resolution