
Overview of This Tutorial - Department of Geosciences

Tutorial: Hyperspectral Signatures and Spectral Resolution
18. See
Draw Conclusions
on page 19, and answer some of the questions pertaining to GER63 data.
19. When you are finished, close the display group, ENVI Plot Window, and Spectral Profile. Keep the
Spectral Library Plots window open for the remaining exercises.
View HyMap Image and Spectra
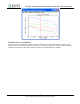
HyMap is a state-of-the-art, aircraft-mounted, hyperspectral sensor developed by Integrated Spectronics,
Sydney, Australia, and operated by HyVista Corporation. HyMap provides unprecedented spatial, spectral and
radiometric resolution (Cocks et al., 1998). The system has a whiskbroom scanner utilizing diffraction gratings
and four 32-element detector arrays to provide 126 spectral channels covering the 0.44 - 2.5 µm range over a
512-pixel swath. Spectral resolution varies from 10 - 20 nm with 3 – 10 m spatial resolution and a signal-to-
noise ratio over 1000:1. The HyMap data described here were acquired on September 11, 1999. Selected
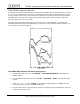
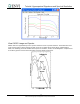
analysis results were published in Kruse et al. (1999). The plot below shows ROI mean spectra for kaolinite,
alunite, and buddingtonite.
View HyMap Mean Kaolinite and Alunite Image Spectra
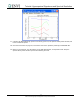
1. From the ENVI main menu bar, select Window → Start New Plot Window. A blank ENVI Plot
Window appears.
2. From the ENVI Plot Window menu bar, select File → Input Data → ASCII. A file selection dialog
appears.
14
ENVI Tutorial: Hyperspectral Signatures and Spectral Resolution