
Overview of This Tutorial - Department of Geosciences

Tutorial: Hyperspectral Signatures and Spectral Resolution
View GER63 Image and Spectra
The Geophysical and Environmental Research 63-band scanner (GER63) has an advertised spectral resolution
of 17.5 nm, but comparison with other sensors and laboratory spectra suggests that 35 nm resolution with
17.5 nm sampling is more likely. Four bad bands were dropped so that only 59 spectral bands are available.
The GER63 data used in this exercise were acquired during August 1987. Selected analysis results were
previously published in Kruse et al. (1990).
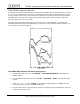
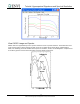
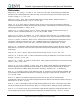
The plot below shows the ROI mean spectra for kaolinite, alunite, and buddingtonite. The GER63 data
adequately discriminate alunite and buddingtonite, but they do not fully resolve the kaolinite “doublet” near
2.2 µm shown in the laboratory spectra.
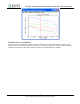
View GER63 Mean Kaolinite and Alunite Image Spectra
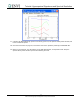
1. From the ENVI main menu bar, select Window → Start New Plot Window. A blank ENVI Plot
Window appears.
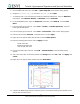
2. From the ENVI Plot Window menu bar, select File → Input Data → ASCII. A file selection dialog
appears.
3. Select cupgerem.txt and click Open. An Input ASCII File dialog appears. Click OK to plot the
kaolinite and alunite spectra in the ENVI Plot Window.
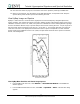
4. Compare these spectra to the USGS library spectra (in the Spectral Library Plots window) and to the
spectra from the other sensors.
12
ENVI Tutorial: Hyperspectral Signatures and Spectral Resolution