REJ10J1116-0400 SH7046 E6000H Emulator User’s Manual Renesas Microcomputer Development Environment System SuperH™ Family / SH7046 Series SuperH™ Family / SH7047 Series SuperH™ Family / SH7144 Series HS7046EPH60HE Rev.4.00 Revision Date: Oct.
Keep safety first in your circuit designs! 1. Renesas Technology Corp. puts the maximum effort into making semiconductor products better and more reliable, but there is always the possibility that trouble may occur with them. Trouble with semiconductors may lead to personal injury, fire or property damage.
IMPORTANT INFORMATION READ FIRST • READ this user's manual before using this emulator product. • KEEP the user's manual handy for future reference. Do not attempt to use the emulator product until you fully understand its mechanism. Emulator Product: Throughout this document, the term "emulator product" shall be defined as the following products produced only by Renesas Technology Corp. excluding all subsidiary products.
LIMITED WARRANTY Renesas warrants its emulator products to be manufactured in accordance with published specifications and free from defects in material and/or workmanship. Renesas, at its option, will repair or replace any emulator products returned intact to the factory, transportation charges prepaid, which Renesas, upon inspection, determine to be defective in material and/or workmanship. The foregoing shall constitute the sole remedy for any breach of Renesas' warranty.
State Law: Some states do not allow the exclusion or limitation of implied warranties or liability for incidental or consequential damages, so the above limitation or exclusion may not apply to you. This warranty gives you specific legal rights, and you may have other rights which may vary from state to state.
SAFETY PAGE READ FIRST • READ this user's manual before using this emulator product. • KEEP the user's manual handy for future reference. Do not attempt to use the emulator product until you fully understand its mechanism. DEFINITION OF SIGNAL WORDS This is the safety alert symbol. It is used to alert you to potential personal injury hazards. Obey all safety messages that follow this symbol to avoid possible injury or death.
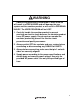
WARNING Observe the precautions listed below. Failure to do so will result in a FIRE HAZARD and will damage the user system and the emulator product or will result in PERSONAL INJURY. The USER PROGRAM will be LOST. 1. Carefully handle the emulator product to prevent receiving an electric shock because the emulator product has a DC power supply. Do not repair or remodel the emulator product by yourself for electric shock prevention and quality assurance. 2.
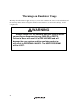
Warnings on Emulator Usage Warnings described below apply as long as you use this emulator. Be sure to read and understand the warnings below before using this emulator. Note that these are the main warnings, not the complete list. WARNING Always switch OFF the emulator and user system before connecting or disconnecting any CABLES or PARTS. Failure to do so will result in a FIRE HAZARD and will damage the user system and the emulator product or will result in PERSONAL INJURY. The USER PROGRAM will be LOST.
CAUTION Place the emulator station and evaluation chip board so that the trace cables are not bent or twisted. A bent or twisted cable will impose stress on the user interface leading to connection or contact failure. Make sure that the emulator station is placed in a secure position so that it does not move during use nor impose stress on the user interface.
CAUTION This equipment has been tested and found to comply with the limits for a Class A digital device, pursuant to part 15 of the FCC Rules. These limits are designed to provide reasonable protection against harmful interference when the equipment is operated in a commercial environment. This equipment generates, uses, and can radiate radio frequency energy and, if not installed and used in accordance with the instruction manual, may cause harmful interference to radio communications.
Preface Thank you for purchasing the E6000H emulator. CAUTION Read this manual before using the emulator product. Incorrect operation or connection will damage the user system, the emulator product, and the user program. The E6000H emulator is an efficient software and hardware development support tool for application systems using the microcomputer developed by Renesas Technology Corp.
About This Manual This manual is comprised of two parts: Hardware Part and Debugger Part. Hardware Part: Preparation before use, hardware specifications, and troubleshooting procedure. Debugger Part: A peculiar debugging function to the emulator, tutorial, Emulator software specification, and notes. This manual describes the debugging function for SH7046 E6000H Emulator debugger that used with the Highperformance Embedded Workshop.
Contents Hardware Part Section 1 Overview........................................................................................... 1 1.1 1.2 1.3 Notes on Usage .................................................................................................................1 Emulator Hardware Components ......................................................................................2 1.2.1 E6000H Station Components...............................................................................3 1.2.
Debugger Part Section 1 Overview ...........................................................................................1 Section 2 Preparation before Use ......................................................................3 2.1 2.2 2.3 2.4 Method for Activating High-performance Embedded Workshop..................................... 3 2.1.1 Creating a New Workspace (Toolchain Not Used).............................................. 4 2.1.2 Creating a New Workspace (Toolchain Used)....................
3.8.1 Opening the [Trace] Window ..............................................................................48 3.8.2 Acquiring Trace Information ...............................................................................48 3.8.3 Specifying Trace Acquisition Conditions ............................................................50 3.8.4 Searching for a Trace Record...............................................................................57 3.8.5 Clearing the Trace Information.....................
4.17 4.18 4.19 4.20 4.16.2 Displaying Trace Information by the Trace Stop Function.................................. 115 4.16.3 Displaying Trace Information by the Conditional Trace Function ...................... 118 4.16.4 Statistics ............................................................................................................... 119 4.16.5 Function Calls ...................................................................................................... 123 Stack Trace Function .........
Hardware Part
Section 1 Overview 1.1 Notes on Usage CAUTION READ the following warnings before using the emulator product. Incorrect operation will damage the user system and the emulator product. The USER PROGRAM will be LOST. 1. Check all components with the component list after unpacking the emulator. 2. Never place heavy objects on the casing. 3.
1.2 Emulator Hardware Components The emulator consists of an E6000H station and an evaluation chip board. By installing a user system interface board (option) on your host computer, the emulator can be connected in the same package as the device. PC interface (option) includes a PC interface board (PCI bus and PC card bus), a LAN adapter (connected with the network), and a USB adapter (connected with the USB interface).
1.2.1 E6000H Station Components (A Part of Photos may be Different from Real Appearances) The names of the components on the front/rear panel of the E6000H station are listed below. Front Panel: Figure 1.2 E6000H Station: Front Panel (a) POWER lamp: Is lit up while the E6000H station is supplied with power. (b) RUN lamp: Is lit up while the user program is running.
Rear Panel: Figure 1.3 E6000H Station: Rear Panel (a) Power switch: Turning this switch to I (input) supplies power to the emulator (E6000H station and evaluation chip board). (b) AC power connector: For an AC 100-V to 240-V power supply. (c) PC interface cable connector: For the PC interface cable that connects the host computer to the E6000H station. A PC interface board, PC card interface, LAN adapter, or USB adapter can be connected. Marked PC/IF.
1.2.2 Evaluation Chip Board Configuration The names of the components on the evaluation chip board of the emulator are listed below. Figure 1.4 Evaluation Chip Board (a) Station to evaluation chip board interface connector cover: This is a cover for protecting the connector that connects the E6000H station to the evaluation chip board. (b) Crystal oscillator terminals: For installing a crystal oscillator to be used as an external clock source for the target MCU.
1.2.3 Configuration of User System Interface Board The names of the components of the user system interface board are given below. Figure 1.5 Configuration of User System Interface Board (a) Connector for the evaluation chip board: For connection to the evaluation chip board. (b) Connector for the user system: For connection to the user system.
1.3 System Configuration The emulator must be connected to a host computer (via the selected PC interface board). 1.3.1 System Configuration Using a PC Interface Board The emulator can be connected to a host computer via a PC interface board (option: PCI bus or PC card bus). Install the PC interface board to the expansion slot for the interface board in the host computer, and connect the interface cable supplied with the PC interface board to the emulator.
Figure 1.
Section 2 Preparation before Use 2.1 Description on Emulator Usage This section describes the preparation before use of the emulator. Figure 2.1 is a flowchart on preparation before debugging with the emulator. CAUTION Read this section and understand its contents before preparation. Incorrect operation will damage the user system and the emulator. The USER PROGRAM will be LOST. Reference: Connect the emulator. Set up the emulator on each OS. Start debugging. Described in this section.
2.2 Emulator Connection 2.2.1 Connecting the User System WARNING Always switch OFF the emulator and user system before connecting or disconnecting any CABLES. Failure to do so will result in a FIRE HAZARD and will damage the user system and the emulator or will result in PERSONAL INJURY. The USER PROGRAM will be LOST. 1. Check that the emulator power switch is turned off. Ensure that the power lamp on the right side of the E6000H station's front panel is not lit. 2.
2.2.2 Connecting the User System Interface Board WARNING Always switch OFF the emulator and user system and check pin numbers on the connectors and IC socket before connecting or disconnecting the USER SYSTEM INTERFACE BOARD. Connection with the power on or incorrect connection will damage the emulator, user system interface board, and user system, and result in a FIRE HAZARD.
2.2.3 Connecting the External Probe CAUTION Check the external probe direction and connect the external probe to the emulator station correctly. Incorrect connection will damage the probe or connector. When an external probe is connected to the emulator probe connector on the E6000H evaluation chip board's rear panel, it enables external signal tracing and multibreak detection. Figure 2.3 shows the external probe connector. Pin No.
2.2.4 Selecting the Clock This emulator supports three types of clock for the target MCU: a crystal oscillator attached on the evaluation chip board, external clock input from the user system, and the emulator internal clock. The clock is specified with the [Configuration] dialog box. This emulator can use a clock source (φ) running at up to 50.0 MHz (four times the external clock frequency of 12.5 MHz) as the MCU clock input.
Enlarged view Crystal oscillator X1 X2 Crystal oscillator terminals Evaluation chip board Figure 2.4 Installing the Crystal Oscillator External Clock: Follow the procedure listed below to select the external clock. 1. Check that the emulator power switch is turned off. (Check that the power LED is not lit.) 2. Connect the evaluation chip board to the user system and supply a clock through the EXTAL pin from the user system. 3. Turn on the user system power and then the emulator power.
2.2.5 Connecting the System Ground CAUTION Separate the frame ground from the signal ground at the user system. When the frame ground is connected to the signal ground and the emulator is then connected to the user system, the emulator will malfunction. The emulator's signal ground is connected to the user system's signal ground via the evaluation chip board. In the E6000H station, the signal ground and frame ground are connected (figure 2.5).
Figure 2.6 Connecting the Frame Ground 2.2.6 PC Interface Board Specifications For details on the PC interface board, LAN adapter, or USB adapter, refer to their description notes.
Section 3 Hardware Specifications 3.1 Environmental Conditions CAUTION Observe the conditions listed in table 3.1 when using the emulator. The following environmental conditions must be satisfied, otherwise the user system and the emulator will not operate normally. The USER PROGRAM will be LOST. Table 3.
3.2 Emulator External Dimensions and Mass Figures 3.1 shows the external dimensions and mass of the E6000H emulator. Figure 3.
3.3 User System Interface Circuit 3.3.1 User System Interface Circuit The circuits that interface the MCU in the emulator to the user system include buffers and resistors. When connecting the emulator to a user system, adjust the user system hardware compensating for FANIN, FANOUT, and propagation delays. The AC timing values when using the emulator are shown in table 3.2. Note: The values with the emulator connected, in table 3.2, are measurements for reference and are not guaranteed values. Table 3.
T1 Tw T2 VOH VOL CK tAD A17 to A0 tCSD1 tCSD2 _CSn tRSD1 tOE tRSD2 _RD (When read) tACC tRDH tRDS D7 to D0 (When read) tWSD1 _WRx (When written) tWSD2 tAS tWDD D7 to D0 (When written) Note: tRDH: Specified from the earliest negation timing from A17 to A0, _CSn, or _RD. Figure 3.
MCU in the emulator MD3 MD2 MD1 MD0 User system HD151015 ALVCH16244A EPM7512AE HD151015 EPM7256AE EPM7512AE FWP MD3 MD2 MD1 MD0 FWP Figure 3.
MCU in the emulator User system VHC244 PVcc 47 kΩ PVcc 47 kΩ PA13/TDO/_BREQ PA13/TDO/_BREQ PA15/_TRST/_BACK PA10/TCK PA12/TDI PA14/TMS PVcc PA15/_TRST/_BACK PA10/TCK PA12/TDI PA14/TMS VHC244 47 kΩ PD4/_AUDRST/D4 PD5/AUDMD/D5 PD7/AUDSYNC/D7 PD6/AUDCK/D6 PD4/_AUDRST/D4 PD5/AUDMD/D5 PD7/AUDSYNC/D7 PD6/AUDCK/D6 PD0/AUDATA0/D0 PD1/AUDATA1/D1 PD2/AUDATA2/D2 PD3/AUDAUA3/D3 PD0/AUDATA0/D0 PD1/AUDATA1/D1 PD2/AUDATA2/D2 PD3/AUDAUA3/D3 LVTH16244 NC _ASEBRKAK _ASEBRKAK PVcc 47 kΩ _DBGMD _DBGMD NC PVc
MCU in the emulator User system HD151015 PVcc HD151015 LVTH16374 AHC14 AHC14 47 kΩ NMI NMI LVTH16374 ALVCH16244A HD151015 PVcc 47 kΩ EPM7256AE _HSTBY _HSTBY PVcc HD15015 EPM7256AE AHC14 AHC14 _RES 47 kΩ _RES ALVTC16244A Figure 3.
MCU in the emulator User system 3Vcc 100 Ω PLLVcc 470 pF 3 kΩ 0.1 μF PLLCAP PLLVss XTAL NC HD15015 NC PLLVcL PLLCAP PLLVss NC XTAL EPM7256AE EXTAL EXTAL EPM7256AE MAX709M UVcc LMC6484AIM 22 kΩ Vcc 3Vcc Vcc 1000 pF 1 kΩ UPVcc 0.01 μF Vss PVcc PVcc 1000 pF 0.01 μF Vcc NC AVcc AVss 0.022 pF AVref AVref 0.01 μF Figure 3.6 User System Interface Circuits (4) 24 AVcc 0.
MCU in the emulator PVcc User system 47 k PA (19:17), PA (9:7), PA5, PA2 PA (19:17), PA (9:7), PA5, PA2 EPM7256AE VHC244 PA (23:20), PA16, PA11, PA6, PA4, PA3, PA1, PA0 PVcc PA (23:20), PA16, PA11, PA6, PA4, PA3, PA1, PA0 47 k PB (9:2) PB (9:2) EPM7256AE VHC244 PB (1:0) PB (1:0) PC (15:0) PC (15:0) PVcc 47 k PD (23:16) PD (23:16) EPM7256AE VHC244 PD (31:24), PD (15:8) PD (31:24), PD (15:8) Figure 3.
MCU in the emulator User system PVcc 47 kΩ PE17 PE17 VHC244 PE (21:18), PE (16:14), PE (12:0) PE (21:18), PE (16:14), PE (12:0) PF (15:0), PG (3:0) PF (15:0), PG (3:0) SN74S1053NS Figure 3.8 User System Interface Circuits (6) 3.3.2 Delay Time with the User System Interface The delay time is generated on the timing of the _RES signal when it is input to the MCU from the user system, as shown in table 3.3, because this connection for this signal is via logic circuit on the evaluation chip board.
3.4 Connecting the Emulator to the User System 3.4.1 Connecting to the User System WARNING Always switch OFF the emulator and user system before connecting or disconnecting any CABLES. Failure to do so will result in a FIRE HAZARD, and will damage the user system or emulator or result in PERSONAL INJURY. Also, the USER PROGRAM will be LOST. The emulator is connected to the user system by using the user system interface board. Table 3.
Installing IC Socket 1. Installing IC Socket Install the IC socket for each package to the user system. After checking the location of pin 1 on the IC socket, apply epoxy resin adhesive to the bottom of the IC, and fasten it to the user system before soldering. 2. Soldering IC Socket After fastening, solder the IC socket to the user system. Be sure to completely solder the leads so that the solder slops gently over the leads and forms solder fillets. (Use slightly more solder than the MCU.
Evaluation chip board Screws (M2.0 × 12 mm) with flat washers User system interface board Spacer Pin 1 IC socket User system Figure 3.9 Connection Using the HS7046ECH61H 11.2 33.1 55.8 Evaluation chip board User system IC socket (IC149-080-017-B5 manufactured by YAMAICHI ELECTRONICS Co., LTD.) Unit: mm Tolerance: ±0.5 mm Figure 3.
20.50 min 14.70 max 0.65 × 19 = 12.35 ± 0.1 0.65 × 19 = 12.35 ± 0.1 0.1 0.35 + - 0.05 0.65 ± 0.05 0.65 ± 0.05 Unit: mm Figure 3.
Connection Using the HS7047ECH61H WARNING Always switch OFF the emulator and user system before connecting or disconnecting any CABLES. Failure to do so will result in a FIRE HAZARD, and will damage the user system or emulator or result in PERSONAL INJURY. Also, the USER PROGRAM will be LOST. Notes: 1. For more details on the HS7047ECH61H, refer to the user’s manual supplied with the emulator. 2.
Evaluation chip board Screws (M2.6 × 12 mm) with flat washers User system interface board Spacer Pin 1 IC socket User system Figure 3.12 Connection Using the HS7047ECH61H 11.2 33.1 55.8 Evaluation chip board User system IC socket (IC149-100-054-B51 manufactured by YAMAICHI ELECTRONICS Co., LTD.) Unit: mm Tolerance: ±0.5 mm Figure 3.
17.10 min 13.80 max 0.50 × 24 = 12.00 ± 0.05 0.50 × 24 = 12.00 ± 0.05 0.30 ± 0.05 0.50 ± 0.05 0.50 ± 0.05 Unit: mm Figure 3.
Connection Using the HS7144ECH61H WARNING Always switch OFF the emulator and user system before connecting or disconnecting any CABLES. Failure to do so will result in a FIRE HAZARD, and will damage the user system or emulator or result in PERSONAL INJURY. Also, the USER PROGRAM will be LOST. Notes: 1. For more details on the HS7144ECH61H, refer to the user’s manual supplied with the emulator. 2.
Evaluation chip board Screws (M2.0 × 12 mm) with flat washers User system interface board Spacer Pin 1 IC socket User system Figure 3.15 Connection Using the HS7144ECH61H User system IC socket (IC149-112C15333-0B manufactured by YAMAICHI ELECTRONICS Co., LTD.) 13.5 11.4 35.4 58.1 Evaluation chip board Unit: mm Tolerance: ±0.5 mm Figure 3.
× × Figure 3.
Connection Using the HS7145ECH61H WARNING Always switch OFF the emulator and user system before connecting or disconnecting any CABLES. Failure to do so will result in a FIRE HAZARD, and will damage the user system or emulator or result in PERSONAL INJURY. Also, the USER PROGRAM will be LOST. Notes: 1. For more details on the HS7145ECH61H, refer to the user’s manual supplied with the emulator. 2. This user system interface board can only be used in combination with the specified QFP socket (NQPACK144SD).
Evaluation chip board Screws (M2.0 × 10 mm) Board Spacer Pin 1 IC socket User system Figure 3.18 Connection Using the HS7145ECH61H User system IC socket (NQPACK144SD manufactured by Tokyo Eletech Corporation) 12.0 11.4 33.9 56.6 Evaluation chip board Unit: mm Tolerance: ±0.5 mm Figure 3.
23.00 19.00 0.5 × 35 = 17.5 7.00 0.25 7.0 0.5 × 35 = 17.5 0.50 0.50 Ø3.2 SL-type 3 - Ø1.0 2.00 Unit: mm Tolerance: ±0.10 mm Figure 3.
Connection Using the Dedicated Connector WARNING Always switch OFF the emulator and user system before connecting or disconnecting any CABLES. Failure to do so will result in a FIRE HAZARD, and will damage the user system or emulator or result in PERSONAL INJURY. Also, the USER PROGRAM will be LOST. Note: This evaluation chip board can only be used in combination with the specified dedicated connector (WD200P-VF85-N).
140.0 83.0 2 1 116.0 200 199 UCN2 2 200 199 UCN1 1 Hole for a connector (NTH) × 4 WD-200P-VF85-N Unit: mm Tolerance: ±0.1 mm Figure 3.23 Location for Mounting the Connector in the User System To design the foot pattern, refer to the catalog on WD-200P-VF85-N for dimensions.
3.4.2 Pin Arrangement on the User System Interface Connector Table 3.5 lists the pin arrangement on the user system interface connector of HS7046EPH60H. Table 3.5 Pin Arrangement on HS7046EPH60H User I/F 1 Pin No. Signal Name User I/F 1 Pin No. Signal Name UCN1 1 GND UCN1 25 N.C. (SMSB0_N) 2 GND 26 GND 3 GND 27 GND 4 GND 28 N.C. (SDB7_P) 42 5 GND 29 N.C. (SE_N) 6 GND 30 N.C. (SDB6_P) 7 GND (TGBON1) 31 N.C. (SMSPT_N) 8 N.C. (SDB15_P) 32 N.C. (SDB5_P) 9 N.C.
Table 3.5 Pin Arrangement on HS7046EPH60H (cont) User I/F 1 Pin No. Signal Name User I/F 1 Pin No. Signal Name UCN1 49 N.C. UCN1 75 N.C. 50 N.C. 76 N.C. 51 N.C. 77 GND 52 N.C. 78 GND 53 N.C. 79 PE21/PWOBB/SCK4/A15 54 N.C. 80 N.C. 55 N.C. 81 PE20/PVOB/TXD4/A14 56 GND 82 PE13/TIOC4B/_MRES 57 GND 83 PE19/PUOB/RXD4/A13 58 N.C. 84 PE12/TIOC4A/TXD1/TXD3 59 N.C. 85 PE18/PWOA/-/A12 60 N.C. 86 PE11/TIOC3D/RXD1/RXD3 61 N.C. 87 GND 62 N.C. 88 GND 63 N.C.
Table 3.5 Pin Arrangement on HS7046EPH60H (cont) User I/F 1 Pin No. Signal Name User I/F 1 Pin No.
Table 3.5 Pin Arrangement on HS7046EPH60H (cont) User I/F 1 Pin No. Signal Name User I/F 1 Pin No.
Table 3.5 Pin Arrangement on HS7046EPH60H (cont) User I/F 2 Pin No. Signal Name User I/F 2 Pin No. UCN2 1 GND UCN2 31 N.C. (SAB1_P) 2 GND 32 MD3 46 Signal Name 3 GND 33 N.C. (SAB2_P) 4 GND 34 MD2 5 GND 35 N.C. (SAB3_P) 6 GND 36 MD1 7 GND 37 GND 8 GND 38 GND 9 N.C. (S0CLR0_N) 39 N.C. (SAB4_P) 10 N.C. (S1CLR0_N) 40 MD0 11 N.C. (S0CLR1_N) 41 N.C. (SAB5_P) 12 N.C. (S1CLR1_N) 42 NMI 13 N.C. (S0CLR2_N) 43 N.C. (SAB6_P) 14 N.C.
Table 3.5 Pin Arrangement on HS7046EPH60H (cont) User I/F 2 Pin No. Signal Name User I/F 2 Pin No. Signal Name UCN2 61 N.C. (SVID3_N) UCN2 90 N.C. (S2REQ3_N) 62 PVCC 91 N.C. (S3REQ0_N) 63 N.C. (SVID2_N) 92 N.C. 64 PVCC 93 N.C. (S3REQ1_N) 65 N.C. (SVID1_N) 94 N.C. 66 N.C. 95 N.C. (S3REQ2_N) 67 GND 96 N.C. 68 GND 97 N.C. (S3REQ3_N) 69 N.C. (SVID0_N) 98 N.C. 70 _RES 99 N.C. (S3REQ4_N) 71 N.C. (S0REQ0_N) 100 N.C. 72 N.C. (SADTRG2_N) 101 GND 73 N.C.
Table 3.5 Pin Arrangement on HS7046EPH60H (cont) User I/F 2 Pin No. Signal Name User I/F 2 Pin No. Signal Name UCN2 119 N.C. UCN2 140 GND 120 AVSS 141 GND 121 GND 142 PF8/AN8 122 PF0/AN0 143 PA6/TCLKA/_CS2/_RD//RXD2/-/- 123 N.C. 144 PF9/AN9 124 PF1/AN1 145 PA7/TCLKB/_CS3/ _WAIT/-/TXD2/-/- 125 N.C.
Table 3.5 Pin Arrangement on HS7046EPH60H (cont) User I/F 2 Pin No. Signal Name User I/F 2 Pin No. UCN2 161 GND UCN2 181 Signal Name GND 162 PG0/AN16 182 EXTAL 163 PA14/_RD/POE5/D6/ TMS/-/-/- 183 PA22/_WRHL/-/-/-/-/-/- 164 PG1/AN17 184 GND 165 PA15/CK/_POE6/D7/ _TRES/_BACK/-/- 185 PA23/_WRHH/-/-/-/-/-/- 166 PG2/AN18 186 N.C. (CKEO_P) 167 PA16/-/_POE7/-/-/-/-/- 187 _WDTOVF 168 PG3/AN19 188 GND 169 PA17/_WAIT/PCIO/-/-/-/-/- 189 PINMD1* 170 N.C.
3.4.3 Precautions on Connecting the User System When connecting the evaluation chip board to the user system, note the followings: 1. Secure the E6000H station location. Place the E6000H station and evaluation chip board so that the station to trace cable is not bent or twisted, as shown below. A bent or twisted cable will impose stress on the user interface, leading to connection or contact failure.
3.5 Support of the Target MCU 3.5.1 Memory Space The MCU has a 4-Gbyte memory space in its architecture. On-Chip ROM Area • Access to the on-chip ROM area The emulator includes substitute RAM for the MCU’s on-chip ROM. The substitute RAM is accessed if an attempt is made to access the on-chip ROM. The on-chip ROM area access differs between user program execution and the emulator commands. Only read access is enabled during execution of the user program.
3.5.2 Low Power-Consumption Mode (Sleep, Software Standby, and Hardware Standby) For reduced power consumption, the MCU has sleep, software standby, and hardware standby modes. Hardware Standby Mode Since the _HSTBY signal from the user system is not input to the MCU in the emulator, the emulator does not support this mode.
3.5.7 A/D Converter The A/D converter has AVcc, AVss, Avref, and _ADTRG pins as well as the analog input pins. As the A/D converter operates with an independent power supply, connect AVcc (the power supply pin) to the A/D power supply on the user system. Notes: 1. When not using the A/D converter, connect AVcc to Vcc. 2.
3.5.9 Pin Functions This emulator supports the extended functions that are not included in the product MCU. Therefore, the pin status, which does not exist in the SH7046, SH7047, SH7144, or SH7145, may be displayed. Table 3.8 shows the difference between the pins of which status is monitored on the emulator and the product MCU. Table 3.
3.5.10 Different Initial Values of Registers in the Emulator Note that the emulator initializes some general or control registers whenever the system is activated or the MCU is reset by commands. Table 3.
56
Section 4 Diagnostic Test Procedure This section describes the diagnostic test procedure using the E6000H diagnostic program. 4.1 System Set-Up for Diagnostic Program Execution To execute the diagnostic program, use the following hardware; do not connect the user system interface board and user system.
Figure 4.1 [Misc] Page 5. Turn on the E6000H emulator switch. Note: To execute the diagnostic program, firstly turn on the power of the emulator. In the diagnostic program, the initial state of hardware is checked. Therefore, after the power is turned on, do not activate the Highperformance Embedded Workshop before executing the diagnostic program.
4.2 Test Item of the Diagnostic Program Table 4.1 shows the test items of this diagnostic program. Table 4.1 Test Items of the Diagnostic Program Test No.
4.3 Diagnostic Test Procedure Using the Diagnostic Program Insert the CD-R (HS7046EPH60SR supplied with the E6000H) into the CD-ROM drive of the host computer, move the current directory to :\Diag with a command prompt, and enter one of the following commands according to the PC interface board used to initiate the diagnostic program: 1. PCI bus interface board (HS6000EIC01H or HS6000EIC02H) > TM7046 –PCI (RET) 2. PC card interface (HS6000EIP01H) > TM7046 –PCCD (RET) 3.
The following messages are displayed during the test. There are 14 steps in this test (when a PCI interface board is used, the time for the test will be about three minutes). Message Description E6000H SH7046 Emulator Tests Vx.x.xx.xxx Test program start message. x.x shows the version number. Loading driver ....................OK (Use PCI) Shows that the PC interface board is correctly installed in the host computer. Initializing driver .......................OK Searching for interface card .........
3. Evaluation Board Access 01) Registers Initial Value Check .............................OK 02) Registers Write/Verify ....................................OK 03) H-UDI IDCODE Check ........................................OK 04) Firmware BOOT .............................................OK 05) Configuration Set .........................................OK 06) Emulation Memory CS0 Test .................................OK 07) Emulation Memory CS1 Test .................................
7. G/A Break Function 01) Address Condition .........................................OK 02) Data Condition ............................................OK 03) Control Signal Condition (ASEDSHH/HL/LH/HL) ...............OK 04) Function Code Condition (ASEAST3-0) .......................OK 05) Control Signal Condition (ASEAA3-0) .......................OK 06) Control Signal Condition (DMA) ............................OK 8. G/A Performance Analysis Function 01) Time Measurement (20ns Sampling) ....................
12. Combination 01) B to A Time Measurement( FPGA counter ) ...................OK 02) B to A Time Measurement( G/A counter ) ....................OK 03) D to C Time Measurement( G/A counter ) ....................OK 13. Parallel Access 01) INROM Parallel Read Access(Byte/Long) .....................OK 02) INROM Parallel Write Access(Byte/Long) ....................OK 03) ERAM Parallel Read Access(Byte/Long) ......................OK 04) ERAM Parallel Write Access(Byte/Long) .....................
Debugger Part
Section 1 Overview The Debugger Part includes the following information. Table 1.1 Debugger Part Contents Section Title Content 2 Preparation before Use This section starts with creation of a workspace and ends with connection to the emulator. 3 Debugging This section describes this emulator ‘s peculiar debugging operation and the associated windows and dialog boxes. Refer to the High-performance Embedded Workshop user's manual about High-performance Embedded Workshop common functions as below.
2
Section 2 Preparation before Use 2.1 Method for Activating High-performance Embedded Workshop To activate the High-performance Embedded Workshop, follow the procedure listed below. 1. Connect the emulator to the host computer. 2. Connect the user system interface cable to the connector of the emulator if you use the user system interface cable. This is not necessary when you do not use the user system interface cable. Turn on the emulator.
2.1.1 Creating a New Workspace (Toolchain Not Used) 1. In the [Welcome!] dialog box that is displayed when the High-performance Embedded Workshop is activated, select [Create a new project workspace] radio button and click the [OK] button. Figure 2.
2. Creation of a new workspace is started. The following dialog box is displayed. Figure 2.3 [New Project Workspace] Dialog Box [Workspace Name] edit box: Enter the new workspace name. [Project Name] edit box: Enter the project name. When the project name is the same as the workspace name, it needs not be entered. [Directory] edit box: Enter the directory name in which the workspace will be created. Click the [Browse…] button to select a directory. [CPU family] combo box: Select the target CPU family.
3. Select the target platform of the session file. The following dialog box is displayed. Figure 2.4 [New Project – Step 7] Dialog Box The target platform for the session file used when the High-performance Embedded Workshop is activated must be selected here. Check the box against the target platform and then click the [Next] button.
4. Set the configuration file name. The configuration file saves the state of High-performance Embedded Workshop except for the emulator. Figure 2.5 [New Project – Step 8] Dialog Box If multiple target platforms were selected in the [New Project – Step 7] dialog box shown in figure 2.5, set the name of a configuration file for each of them, each time clicking the [Next] button to proceed to the next target. Setting of the configuration file name is the end of the emulator settings.
2.1.2 Creating a New Workspace (Toolchain Used) 1. In the [Welcome!] dialog box that is displayed when the High-performance Embedded Workshop is activated, select the [Create a new project workspace] radio button and click the [OK] button. Figure 2.
2. Creation of a new workspace is started. The following dialog box is displayed. Figure 2.7 [New Project Workspace] Dialog Box [Workspace Name] edit box: Enter the new workspace name. [Project Name] edit box: Enter the project name. When the project name is the same as the workspace name, it needs not be entered. [Directory] edit box: Enter the directory name in which the workspace will be created. Click the [Browse…] button to select a directory. [CPU family] combo box: Select the target CPU family.
3. Make the required setting for the toolchain. When the setting has been completed, the following dialog box is displayed. Figure 2.8 [New Project – Step 7] Dialog Box The target platform for the session file used when the High-performance Embedded Workshop is activated must be selected here. Check the box against the target platform and then click the [Next] button.
4. Set the configuration file name. The configuration file saves the state of High-performance Embedded Workshop except for the emulator. Figure 2.9 [New Project – Step 8] Dialog Box If multiple target platforms were selected in the [New Project – Step 7] dialog box shown in figure 2.9, set the configuration file name for each of them, each time clicking the [Next] button to proceed to the next target. Setting of the configuration file name is the end of the emulator settings.
2.1.3 Selecting an Existing Workspace 1. In the [Welcome!] dialog box that is displayed when the High-performance Embedded Workshop is activated, select [Browse to another project workspace] radio button and click the [OK] button. Figure 2.10 [Welcome!] Dialog Box 2. The [Open Workspace] dialog box is displayed. Select a directory in which you have created a workspace. After that, select the workspace file (.hws) and click the [Open] button. Figure 2.11 [Open Workspace] Dialog Box 3.
2.2 Connecting the Emulator Select either of the following two ways to connect the emulator: (a) Connecting the emulator after the setting at emulator activation Select [Debug -> Debug Settings…] to open the [Debug Settings] dialog box. It is possible to register the download module or the command chain that is automatically executed at activation. When the dialog box is closed after setting the [Debug Settings] dialog box, the emulator will automatically be connected.
2.3 Re-connecting the Emulator When the emulator is disconnected, re-connection is possible by using the following methods. Select [Debug -> Connect] or click the [Connect] toolbar button ( ) to re-connect the emulator. Note: When re-connecting the emulator, the load module must be registered to the High-performance Embedded Workshop beforehand. 2.
Section 3 Debugging This section describes the debugging operations and their related windows and dialog boxes. 3.1 Setting the Environment for Emulation The method for setting the environment for emulation is described here. This environment must be set correctly before debugging is started. 3.1.1 Opening the [Configuration Properties] Dialog Box Selecting [Setup -> Emulator -> System…] or clicking the [Emulator System] toolbar button ( [Configuration Properties] dialog box. ) opens the Figure 3.
[General] page [Device] Selects the target MCU to be emulated. See the hardware manual for details. [Mode] Selects the operating mode of the target MCU. [Clock] Selects the speed of the input clock of the target MCU. Select one of the followings: Emulator Clock (x MHz): Clock signal of the emulator (x: 4, 6, 8, 10, or 12.5) Target: Clock signal from the user system Xtal: Crystal oscillator on the evaluation chip board [Clock Mode] Sets the operating clock mode of the target MCU.
3.1.2 Settings Associated with the Pin Function Controller The [Pin Select Registers] page of the [Configuration Properties] dialog box allows setting of the pins selected by the pin function controller (PFC). The emulator correctly sets these pins that correspond to the signals for use in the following functions.
[Pin Select Registers] page Option Description [IRQ0] Sets the pins (PA2, PB2, PD16, HIGH) that correspond to the IRQ0 signal. [IRQ1] Sets the pins (PA5, PB3, PD17, HIGH) that correspond to the IRQ1 signal. [IRQ2] Sets the pins (PA8, PB4, PD18, HIGH) that correspond to the IRQ2 signal. [IRQ3] Sets the pins (PA9, PB5, PD19, HIGH) that correspond to the IRQ3 signal. [IRQ4] Sets the pins (PB6, PD20, HIGH) that correspond to the IRQ4 signal.
3.1.3 Selecting the Interface to be Connected Checking [Change driver in start up] on the [Configuration Properties] dialog box allows a selection of the driver next time the emulator is connected. Figure 3.3 [Driver Details] Dialog Box [Driver]: Selects the driver that connects the High-performance Embedded Workshop and the emulator. [Details]: Sets the details of the driver being connected. [Interface]: The name of the interface to be connected. This should not be changed in this emulator.
3.1.4 Opening the [Memory Mapping] Dialog Box Selecting [Setup -> Emulator -> Memory Resource…] or clicking the [Emulator Memory Resource] toolbar button ( ) opens the [Memory Mapping] dialog box. Figure 3.4 [Memory Mapping] Dialog Box [Add...]: Displays the [Edit Memory Mapping] dialog box, allowing the user to modify the address range and attributes of a memory map. [Modify...
3.1.5 Changing the Memory Map Setting Clicking the [Add…] button on the [Memory Mapping] dialog box or clicking the [Modify…] button after selecting the information on the memory map setting you want to change opens the [Edit Memory Mapping] dialog box. Figure 3.5 [Edit Memory Mapping] Dialog Box Use this dialog box to change the address range and attributes of a memory map. [From]: Enter the start address of the map range. [To]: Enter the end address of the map range.
3.2 Downloading a Program This section describes how to download a program and view it as source code or assembly-language mnemonics. Note: After a break has occurred, the [Editor] window displays the location of the present program counter (PC). In most cases, for example if an Elf/Dwarf2-based project is moved from its original path, the source file may not be automatically found. In this case, a source file browser dialog box is displayed to allow you to manually locate the source file. 3.2.
In this window, the following items are shown on the left as information on lines. • 1st column (Line Number column): A line number for the source file • 2nd column (Source Address column): Address information for the source line • 3rd column (On Chip Break column): On-chip breaks • 4th column (S/W Breakpoints column): PC, bookmark, and breakpoint information The text area is displayed in the right part of the [Editor] window.
To switch off a column in all source files 1. Click the right-hand mouse button on the [Editor] window or select the [Edit] menu. 2. Click the [Define Column Format…] menu item. 3. The [Global Editor Column States] dialog box is displayed. 4. A check box indicates whether the column is enabled or not. If it is checked, the column is enabled. If the check box is gray, the column is enabled in some files and disabled in others. Deselect the check box of a column you want to switch off. 5.
3.2.3 Viewing the Assembly-Language Code If you have a source file open, right-click to open the pop-up menu and select the [View Disassembly] option to open a Disassembly view at the same address as the current Source view. It is also possible to view the disassembly using the new integrated [Disassembly view] in the source file.
3.2.4 Modifying the Assembly-Language Code You can modify the assembly-language code by double-clicking on the instruction that you want to change. The [Assembler] dialog box will be opened. Figure 3.9 [Assembler] Dialog Box The address, instruction code, and mnemonic are displayed. Enter a new instruction or edit the old instruction in the [Mnemonics] field. Pressing the [Enter] key will replace the memory content with the new instruction and move on to the next instruction.
3.3 Viewing the Current Status Choose [View -> CPU -> Status] or click the [View Status] toolbar button ( see the current status of the debugging platform. ) to open the [Status] window and Figure 3.11 [Status] Window The [Status] window has following three sheets: • [Memory] sheet Displays information about the current memory status including the memory mapping resources and the areas used by the currently loaded object file.
3.4 Reading and Displaying the Emulator Information Regularly Use the [Extended Monitor] window to know the changing information on the emulator no matter the user program is running or halted. Note: 3.4.1 The extended monitor function does not affect the execution of the user program since it monitors the user system or the signal output from the target MCU in the emulator by using the emulator’s hardware circuit.
3.4.2 Selecting Items to be Displayed Selecting [Properties…] from the popup menu displays the [Extended Monitor Configuration] dialog box. Figure 3.13 [Extended Monitor Configuration] Dialog Box This dialog box allows the user to set the items to be displayed in the [Extended Monitor] window. Note: The items that can be set in this window depend on the emulator in use. For details, refer to the online help.
3.5 Displaying Memory Contents in Realtime Use the [Monitor] window to monitor the memory contents during user program execution. In the Monitor function, the realtime operation is retained since the bus monitoring circuit of the emulator sets the read/write signal of the MCU as a trigger and holds the address bus and data bus values to update the displayed contents of the memory. Up to eight points or 256 bytes in total can be set by using the eight monitoring channels on the bus monitoring circuit.
[Name]: Decides the name of the monitor window. [Options]: Sets monitor conditions. [Address]: Sets the start address for monitoring. [Size]: Sets the range for monitoring. [Access]: Sets the access size to be displayed in the monitor window. [Auto-Refresh at rate]: Sets the interval for acquisition by monitoring (500 ms at minimum). [Reading the Initial Value]: Selects reading of the values in the monitored area when the monitor window is opened.
Figure 3.15 [Monitor] Window During user program execution, the display is updated according to the setting value of the auto-update interval. Note: Select [Refresh] from the popup menu when data is not displayed correctly after changing the address or content of memory. 3.5.2 Changing the Monitor Settings Selecting [Monitor Setting…] from the popup menu of the [Monitor] window displays the [Monitor Setting] dialog box, which allows the settings to be changed.
3.5.6 Hiding the [Monitor] Window When using the Monitor function to monitor the value of a variable from the [Watch] window, hide the [Monitor] window for the effective use of the screen. The current monitoring information is listed as the submenu when selecting [Display -> CPU -> Monitor]. The list consists of the [Monitor] window name and the address to start monitoring. When the left of the list is checked, the [Monitor] window is being displayed.
3.5.7 Managing the [Monitor] Window Selecting [Display -> CPU -> Monitor -> Windows Select…] displays the [Windows Select] dialog box. In this window, the current monitoring condition is checked and the new monitoring condition is added, edited, and deleted in succession. Selecting multiple monitoring conditions enables a temporary stop of update, hiding, and deletion. Figure 3.17 [Windows Select] Dialog Box [Add]: Adds a new monitoring condition.
3.6 Looking at Variables This section describes how you can look at variables in the source program. 3.6.1 [Watch] Window You can view any value in the [Watch] window. Figure 3.18 [Watch] Window The [R] mark shows that the value of the variable can be updated during user program execution. It is possible to recognize the method for updating the value during user program execution according to the color of the [R] mark.
Notes: 1. This function can be set per variable or per element or body for structures of data. 36 2. The color of an [R] in the [Name] column changes according to the monitoring settings. 3. A variable that is allocated to a register cannot be selected for monitoring. 4. The procedure to display or modify the contents of memory differs depending on the product. If the display of memory contents is updated during execution of the user program, realtime emulation may not be available.
3.7 Using the Event Points The emulator has the event point function to support breakpoints of the following three types. Software breakpoints: Execution of the user program stops when the instruction at the specified address is fetched. Up to 255 software breakpoints can be set. Any content at the specified address is replaced by a break instruction (a dedicated instruction for use with the emulator).
3.7.1 Setting a Software Breakpoint Use the [Software] sheet on the [Event] window to display, change, or add settings for software breakpoints. Select [Add...] or [Edit…] from the popup menu displayed on the [Software] sheet. The [Breakpoint Properties] dialog box (the [Software Break] page) will appear. Figure 3.
To add a new software breakpoint, select an empty line from the list box on the [Software Break] page and click the [Edit…] button. To change existing settings, select the software breakpoint that you want to change from the list box and click the [Edit…] button. The [Software Break] dialog box is displayed. Figure 3.21 [Software] Dialog Box ([Address] Page) Specify the breakpoint’s address in the [Address] edit box and click the [OK] button.
3.7.2 Setting an On-Chip Breakpoint Use the [On Chip] sheet on the [Event] window to display, change, or add settings for on-chip breakpoints. Select [Add...] or [Edit…] from the popup menu displayed on the [On Chip] sheet. The [Breakpoint Properties] dialog box (the [On Chip Break] page) will appear. Figure 3.22 [Breakpoint Properties] Dialog Box ([On Chip Break] Page) [Sequential Break]: Use this item to specify a sequential break consisted of on-chip breakpoints.
[Back]: Puts the setting back to the previous state at the time the dialog box has been displayed. List box: Displays the current settings for each of the channels. R shown as the channel number indicates that a reset point is set for a sequential break. If no setting has been made for a channel, only the channel number is displayed here. When a channel is used for the sequential break function, S is displayed next to the channel number.
[Address]: Sets address bus conditions. [Don’t Care]: Selects no address bus condition. [Address]: Sets an address bus value. It is also possible to specify a label as the address value. [Use mask]: Sets mask conditions. Set the mask bits if [Use mask] is selected. Masked bits satisfy this break condition regardless of their values. [Data]: Sets data bus conditions. [Don’t Care]: Selects no data bus condition. [Value]: Sets a data bus value. [Use mask]: Sets mask conditions.
3.7.3 Settings an On-Emulator Breakpoint Use the [On Emulator] sheet on the [Event] window to display, change, or add settings for on-emulator breakpoints. Select [Add...] or [Edit…] from the popup menu displayed on the [On Chip] sheet. The [Breakpoint Properties] dialog box (the [On Emulator Break] page) will appear. Figure 3.24 [Breakpoint Properties] Dialog Box ([On Emulator Break] Page) List box: Displays the current settings for each of the channels.
The user can set more complex break conditions in the [On Emulator Break Channel n] dialog box by a combination of conditions provided on pages [Address], [Data], [Bus/Area], [Probe], [Interrupt], and [Count]. Figure 3.
[Address]: Sets address conditions. It is also possible to specify a label as the address value. [Don’t Care]: Selects no address bus condition. [Address]: Select this button to set the address bus value specified in [Start] as the break condition. [Range]: A break occurs in the range of the address bus values specified from [Start] (start address) to [End] (end address). [Outside Range]: Select this option to generate a break with an address bus outside the range set in [Range].
[External]: Selects an external area where no emulation memory is allocated as the condition. [Emulator]: Selects an external area where emulation memory is allocated as the condition. [Read/Write]: Sets read/write conditions. When [Don’t Care] has been selected, no read/write condition can be set. [Probe]: Sets the levels (high or low) of the external probe signals (PRB1 to PRB4) as the condition.
3.7.9 Deleting All Event Points Choose [Delete All] from the popup menu to remove all event points. 3.7.10 Viewing the Source Line for an Event Point Select an event point and choose [Go to Source] from the popup menu to open the [Editor] or [Disassembly] window at the address of the event point. The [Go to Source] menu is only available when one event point that has the corresponding source file is selected.
3.8 Viewing the Trace Information The emulator acquires the results of each instruction execution into the trace buffer as trace information and displays it in the [Trace] window. The conditions for the trace information acquisition can be specified in the [Trace Acquisition] dialog box. Since trace information in bus-cycles is acquired by the hardware circuit and stored in the trace buffer, the realtime operation is retained.
[R/W]: Whether an access was read (RD) or write (WR) [SZ]: Selects the size of an access as B (byte), W (word), or L (longword). [Status]: Bus state; DMA (internal DMAC/DTC execution cycle), AUD (AUD cycle), BRL (user bus release), DAT (CPU data access cycle except for PC-relative data access), IF (CPU instruction fetch cycle including PC-relative data access), or OTH (other cases).
3.8.3 Specifying Trace Acquisition Conditions The capacity of the trace buffer is limited. When the buffer becomes full, the oldest trace information is overwritten. Setting the trace acquisition condition allows acquisition of useful trace information and effective use of the trace buffer. There are the following types of trace acquisition conditions.
(1) [Condition] page Figure 3.27 [Trace Acquisition Properties] Dialog Box ([Condition] Page) [Sequential Trace Stop]: Use this option to set a sequential trace stop by using channels 1 to 7. The sequential trace stop function allows trace acquisition to stop when the conditions of several channels are satisfied in the specified order. Two to seven pass points and one reset point are selectable as sequential trace stop conditions. The conditions are satisfied in the order of 1 to 7.
List box: Displays the current settings for each of the channels. If no setting has been made for a channel, only the channel number is displayed here. When a channel is used for the sequential trace stop function, S is displayed next to the channel number. When a reset condition for a sequential trace stop is enabled, R is displayed next to channel 8. PtoP is for use in the Point to Point trace. UNUSED is displayed next to the channel number if that channel is not available.
(2) [Other] page Figure 3.28 [Trace Acquisition] Dialog Box ([Other] Page) [When trace-buffer full]: Selects an action to take when the trace buffer becomes full. [No action]: Overwrites the oldest information in the trace buffer. [Stop trace]: Stops trace acquisition without stopping the user program execution. [Stop execution and trace]: Stops the user program execution. [Time measurement unit]: Selects the minimum time unit for the time stamping of the bus trace information.
[Clock/8]: Time stamping is in terms of the number of bus-clock cycles, i.e., is synchronized with 1/8 cycle of the system clock signal (φ). [Selection of the trace contents]: Selects whether or not to display time stamps, IRQs, or executed instructions. [Time stamp]: Displays IRQs if the level of any of IRQ7-0 is low. This allows any 32-bit time stamp information to be displayed. [IRQ7-0 all indications]: Displays the status of IRQ7-0 in bit units. Lower 16 bits of time stamps are fixed to 0.
(3) [Trace Acquisition Condition Channel n] dialog box Use this dialog box to set pass points and a reset point for a sequential trace stop, and conditions in the address range trace, address range conditional trace, conditional trace, Point to Point trace, execution time measurement, and a trigger output. Figure 3.
[Start]: Set the start address. [End]: Set the end address. [f()…]: The address range of a function can be set by [Start] and [End]. [Output Trigger]: Outputs a trigger after the satisfaction of a trace condition. [Address]: Sets address conditions. [Data]: Sets data conditions. [Bus/Area]: Sets access type, bus status, and read/write cycle conditions. [Probe]: Sets the levels (high or low) of the external probe signals (PRB1 to PRB4) as the condition.
3.8.4 Searching for a Trace Record Use the [Trace Find] dialog box to search for a trace record. To open this dialog box, choose [Find...] from the popup menu. Figure 3.30 [Trace Find] Dialog Box The [Trace Find] dialog box has the following options: [General]: [Not designation]: Searches for information that does not match the conditions set in other pages when this box is checked. [Upward search]: Searches upwards when this box is checked. [Start PTR]: Enters a PTR value to start a search.
[Status]: Selects the status of a bus as the condition. [Don't care]: Detects no bus condition when this box is checked. [Setting]: Detects the specified bus condition. [Area]: Selects the area being accessed. [Don't care]: Detects no area condition when this box is checked. [Setting]: Detects the specified area condition. [Probes]: Sets a probe signal condition. [Don't care]: Detects no probe signal condition when this box is checked. [Setting]: Detects the specified probe signal condition.
3.8.6 Saving the Trace Information in a File Select [Save...] from the popup menu to open the [Save As] file dialog box, which allows the user to save the information displayed in the [Trace] window as a text file. A range can be specified based on the [PTR] number (saving the complete buffer may take several minutes). Note that this file cannot be reloaded into the [Trace] window. Note: In filtering of trace information, the range to be saved cannot be selected.
3.8.11 Extracting Records from the Acquired Information Use the filtering function to extract the records you need from the acquired trace information. The filtering function allows the trace information acquired by hardware to be filtered by software.
[Data]: Specifies a single address. [Range]: Specifies an address range. [From]: Enter a single address value or the start value of the address range. [To]: Enter the end value of the address range. Sets data conditions. [Don't care]: Detects no data when this box is checked. [Setting]: Detects the specified data. [R/W]: [Point]: Specifies single data. [Range]: Specifies a data range. [From]: Enter a single value or the minimum value of the data range.
High: The status of the IRQ signal is high. Low: The status of the IRQ signal is low. [Timestamp]: Sets the time stamp condition. [Don't care]: Detects no time stamp value when this box is checked. [Setting]: Detects the specified time stamp value. [Point]: Specifies a single time stamp. [Range]: Specifies a time stamp range. [From]: Enter a single time stamp value or the minimum value of the time stamp range.
3.8.12 Calculating the Difference in Time Stamping Select [Timestamp Difference…] from the popup menu to calculate the time difference between the two points selected by the result of tracing in acquisition of time stamp information. Figure 3.32 [Timestamp Difference] Dialog Box [Select 2 line]: Select trace records to calculate the time stamp difference. [First PTR]: Specifies the first pointer to measure the difference. The pointer of the line selected on the [Trace] window is displayed by default.
3.8.13 Analyzing Statistical Information Choose [Statistic] from the popup menu to open the [Statistic] dialog box and analyze statistical information under the specified conditions. Figure 3.33 [Statistic] Dialog Box [Statistic Analysis]: 64 Setting required for analysis of statistical information. [Default]: Sets a single input value or character string. [Range]: Sets the input value or character string as a range. [Item]: Sets the item for analysis.
This dialog box allows the user to analyze statistical information concerning the trace information. Set the target of analysis in [Item] and the input value or character string by [Start] and [End]. Click the [Result] button after setting a condition by pressing the [New] or [Add] button to analyze the statistical information and display its result in the [Result] list. Note: In this emulator, only [PTR] can be set as a range. Each of other items must be specified as a character string.
3.9 Analyzing Performance Use the performance analysis function to measure the rate of execution time. The performance analysis function does not affect the realtime operation because it measures the rate of execution time in the specified range by using the circuit for measurement of hardware performance included in the emulator. Select one of the following five modes according to the purpose of measurement. Table 3.
Table 3.
3.9.1 Opening the [Performance Analysis] Window Choose [View -> Performance -> Performance Analysis] or click the [PA] toolbar button ( [Select Performance Analysis Type] dialog box. ) to open the Figure 3.35 [Select Performance Analysis Type] Dialog Box Select [E6000H Performance Analysis] and then click the [OK] button to open the [Performance Analysis] window. Figure 3.
3.9.2 Setting Conditions for Measurement Conditions for measurement can be displayed and changed in the [Performance Analysis] window. Select a point where a condition is to be set, and then select [Set…] from the popup menu to display the [Performance Analysis Properties] dialog box. Select either from the following five modes as the condition by the [Measurement Method] option: Table 3.
(1) Time Of Specified Range Measurement Figure 3.38 Time Of Specified Range Settings [Range Name]: The name of the range to be measured [Range]: The range for the Time Of Specified Range Measurement [Start Address]: Address to start measurement [End Address]: Address to end measurement Measures the execution time and the execution count in the range between the start address and end address.
(2) Start Point To End Point Measurement Figure 3.39 Start Point To End Point Measurement Settings [Range Name]: The name of the range to be measured [Point]: The range for the Start Point To End Point Measurement [Start Address]: Address to start measurement [End Address]: Address to end measurement [Time Out Action]: The action to take when a timeout or count-out occurs. Disable: Disables setting of a timeout or count-out value.
[Count]: The count-up value used in measurement of the execution count. A break occurs every time the execution count exceeds the count-up value. This is only available for channel 1. Measures the execution time and the execution count in the range between start address and end address. Starts measurement with a detected program prefetch at the start address, and then stops with a detected program prefetch at the end address.
(3) Start Range To End Range Measurement Figure 3.
(4) Access Count Of Specified Range Measurement Figure 3.
(5) Called Count Of Specified Range Measurement Figure 3.42 Called Count Of Specified Range Measurement Settings [Range Name]: The name of the range to be measured [Range]: The range for the Called Count Of Specified Range Measurement [Start Address]: Start address [End Address]: End address [Call Range]: The range for the Called Count Of Specified Range Measurement. As the call range, specify the start and end addresses of the selected subroutine.
3.9.3 Starting Performance Data Acquisition Executing the user program clears the result of previous measurement and automatically starts measuring the rate of execution time according to the conditions that have been set. Stopping the user program displays the result of measurement in the [Performance Analysis] window. 3.9.4 Deleting a Measurement Condition Select [Reset] from the popup menu with a measurement condition selected to delete the condition. 3.9.
3.10 Profiling Function 3.10.1 Enabling the Profile Choose [View->Performance->Profile] to open the [Profile] window. Choose [Enable Profiler] from the popup menu of the [Profile] window. The item on the menu will be checked. 3.10.2 Specifying Measuring Mode You can specify whether to trace functions calls while profile data is acquired. When function calls are traced, the relations of function calls during user program execution are displayed as a tree diagram.
3.10.4 [List] Sheet Figure 3.43 [Profile] Window ([List] Sheet) This window displays the address and size of a function or a global variable, the number of times the function is called or the global variable is accessed, and profile data. When the column header is clicked, data are sorted in alphabetic or numeric ascending/descending order. Double-clicking the [Function/Variable] or [Address] column displays the source program of the address in the line.
3.10.5 [Tree] Sheet Figure 3.44 [Profile] Window ([Tree] Sheet) This window displays the relation of function calls in a tree structure. Displayed contents are the address, size, stack size, and number of function calls and execution cycles. The stack size and number of function calls are values when the function is called. The [Tree] sheet is only available when [Not trace the function call] is not checked in the popup menu of the [Profile] window.
• Not trace the function call Stops tracing function calls while profile data is acquired. This menu is used when acquiring profile data of the program in which functions are called in a special way, such as task switching in the OS. To display the relation of function calls in the [Tree] sheet of the [Profile] window, acquire profile data without selecting this menu.
3.11 [Profile-Chart] Window Figure 3.45 [Profile-Chart] Window This window displays the relation of calls for a specific function. This window displays the calling relation for the function specified in the [List] sheet or [Tree] sheet in the [Profile] window. The specified function is displayed in the middle, the calling function on the left side, and the called function on the right side. Values beside the calling and called functions show the number of times the function has been called.
• Multiple View If the [Profile-Chart] window is going to be opened when it has already been opened, selects whether another window is to be opened or the same window is to be used to display data. When a check mark is shown to the left side of the menu text, another window is opened. • Output Profile Information File… Displays the [Save Profile Information File] dialog box. Profiling results are saved in a profile information file (.pro extension).
Section 4 Tutorial 4.1 Introduction This section describes the main functions of the emulator by using a tutorial program. The tutorial program is based on the C++ program that sorts ten random data items in ascending or descending order. The tutorial program performs the following actions: • The main function repeatedly calls the tutorial function to repeat sorting. • The tutorial function generates random data to be sorted and calls the sort and change functions in that order.
4.2 Running the High-performance Embedded Workshop Open a workspace by following the procedure listed in section 2.1.3, Selecting an Existing Workspace. Select the following directory. OS installation drive \Workspace\Tutorial\E6000H\7046 Note: The directory mentioned above cannot be specified depending on the version of the software. In such cases, specify the following directory instead.
4.3 Downloading the Tutorial Program 4.3.1 Downloading the Tutorial Program Download the object program to be debugged. • Select [Download module] from [Tutorial.abs] of [Download modules]. Figure 4.
4.3.2 Displaying the Source Program The High-performance Embedded Workshop allows the user to debug a user program at the source level. • Double-click [Tutorial.cpp] under [C++ source file]. Figure 4.3 [Editor] Window (Displaying the Source Program) • Select a font and size that are legible if necessary. Initially the [Editor] window shows the start of the user program, but the user can use the scroll bar to scroll through the user program and look at the other statements.
4.4 Setting a Software Breakpoint A software breakpoint is a simple debugging function. The [Editor] window provides a very simple way of setting a software breakpoint at any point in a program. For example, to set a software breakpoint where the sort function is called: • Select by double-clicking the [S/W Breakpoints] column on the line containing the sort function call. Figure 4.4 [Editor] Window (Setting a Software Breakpoint) The symbol • will appear on the line containing the sort function.
4.5 Setting Registers Set a value in the program counter before executing the program. • Select [Registers] from the [CPU] submenu of the [View] menu or click the [Register] toolbar button ( display the [Register] window. ) to Figure 4.5 [Register] Window • To change the value of the program counter (PC), double-click on the PC value area in the [Register] window with the mouse. The following dialog box is then displayed, and the value can be changed.
4.6 Executing the Program Execute the program as described in the following: • To execute the program, select [Go] from the [Debug] menu, or click the [Go] button on the toolbar. Figure 4.7 [Go] Button While the program is executed, the current address bus value and the operating state of the MCU are displayed on the status bar.
Figure 4.
The user can see the cause of the break that occurred last time in the [Status] window. • Select [Status] from the [CPU] submenu of the [View] menu or click the [Status] toolbar button ( ). After the [Status] window is displayed, open the [Platform] sheet, and check the Status of Cause of last break. Figure 4.9 [Status] Window Note: The items that can be displayed in this window differ depending on the product. For the items that can be displayed, refer to section 3, Debugging, or the online help.
4.7 Reviewing Breakpoints The user can see all the breakpoints set in the program in the [Event] window. • Select [Eventpoints] from the [Code] submenu of the [View] menu or click the [Eventpoints] toolbar button ( ). The [Event] window is displayed. Select the [Software] sheet. Figure 4.10 [Event] Window The popup menu, opened by clicking the [Event] window with the right-hand mouse button, allows the user to set or change breakpoints, define new breakpoints, and delete, enable, or disable breakpoints.
4.8 Referring to Symbols The [Label] window can be used to display the information on symbols in modules. Select [Label] from the [Symbol] submenu of the [View] menu. The [Label] window is displayed so that the user can refer to the addresses of symbols in modules. Figure 4.
4.9 Viewing Memory When the label name is specified, the user can view the memory contents that the label has been registered in the [Memory] window. For example, to view the memory contents corresponding to _main in byte size: • Select [Memory …] from the [CPU] submenu of the [View] menu or click the [View Memory] toolbar button ( ) to open the [Format] dialog box. Enter _main in the [Begin] edit box and +ff in the [End] edit box, respectively, and select Byte in the [Format] combo box. Figure 4.
4.10 Watching Variables As the user steps through a program, it is possible to watch that the values of variables used in the user program are changed. For example, set a watch on the long-type array a declared at the beginning of the program, by the following procedure: • Click the left of displayed array a in the [Editor] window to place the cursor. • Select [Instant Watch...] with the right-hand mouse button. The following dialog box will be displayed. Figure 4.
The user can also add a variable to the [Watch] window by specifying its name. • Click the [Watch] window with the right-hand mouse button and select [Add Watch…] from the popup menu. The following dialog box will be displayed. Figure 4.16 [Add Watch] Dialog Box • Enter variable i to [Variable or expression] edit box and click the [OK] button. The [Watch] window will now also show the int-type variable i. Figure 4.
The user can click mark ‘+’ at the left side of array a in the [Watch] window to watch all the elements. Figure 4.
4.11 Displaying Local Variables The user can display local variables in a function by using the [Locals] window. For example, we will examine the local variables in the tutorial function, which declares local variables j, i, and p_sam. • Select [Locals] from the [Symbol] submenu of the [View] menu. The [Locals] window is displayed. The [Locals] window shows the local variables in the function currently pointed to by the program counter, along with their values.
4.12 Stepping Through a Program The High-performance Embedded Workshop provides a range of step menu commands that allow efficient program debugging. Table 4.2 Step Options Menu Command Description Step In Executes each statement, including statements within functions. Step Over Executes a function call in a single step. Step Out Steps out of a function, and stops at the statement following the statement in the program that called the function.
Figure 4.21 [Editor] Window (Step In) • The highlighted line moves to the first statement of the sort function in the [Editor] window.
4.12.2 Executing the [Step Out] Command The [Step Out] command steps out of the called function and stops at the next statement of the calling statement. • To step out of the sort function, select [Step Out] from the [Debug] menu, or click the [Step Out] button in the toolbar. Figure 4.22 [Step Out] Button Figure 4.23 [High-performance Embedded Workshop] Window (Step Out) The data of variable a displayed in the [Watch] window is sorted in the ascending order.
4.12.3 Executing the [Step Over] Command The [Step Over] executes a function call in a single step and stops at the next statement of the main program. • To step through all statements in the change function in a single step, select [Step Over] from the [Debug] menu, or click the [Step Over] button on the toolbar. Figure 4.24 [Step Over] Button Figure 4.25 [High-performance Embedded Workshop] Window (Step Over) The data of variable a displayed in the [Watch] window is sorted in the descending order.
4.13 Forced Breaking of Program Executions The High-performance Embedded Workshop can force a break during the execution of a program. • Cancel all the breakpoints. • To execute the remaining sections of the tutorial function, select [Go] from the [Debug] menu or the [Go] button on the toolbar. Figure 4.26 [Go] Button • The program goes into an endless loop. To force a break during execution, select [Halt] from the [Debug] menu or the [Halt] button on the toolbar. Figure 4.27 [Halt] Button 4.
4.15 Break Function The emulator provides break functions by software breaks, on-chip breaks, and on-emulator breaks. Software breakpoints, on-chip breakpoints, and on-emulator breakpoints can be set in the High-performance Embedded Workshop’s [Event] window. An overview and setting of the break function are described below. 4.15.1 Software Break Function The emulator can set up to 255 software breakpoints.
Figure 4.
• Click the [Edit…] button to display the [Software Break] dialog box. Figure 4.32 [Software Break] Dialog Box • Use the [Editor] window to refer to the address on the line that has ‘p_sam->s0=a[0];’ within the tutorial function and enter this address in the [Address] edit box. In this example, enter H’000010A4. Note: This dialog box differs depending on the product. For the items of each product, refer to section 3, Debugging, or the online help. • Click the [OK] button.
The software breakpoint that has been set is displayed in the [Event] window. Figure 4.33 [Event] Window (Software Breakpoint Setting) Note: The items that can be displayed in this window differ depending on the product. For the items that can be displayed, refer to section 3, Debugging, or the online help. • Close the [Event] window. • To stop the tutorial program at the breakpoint, select [Reset Go] from the [Debug] menu.
The program runs until it stops at the breakpoint that has been set. Figure 4.
The [Status] window displays the following contents: Figure 4.35 Displayed Contents of the [Status] Window (Software Break) Note: The items that can be displayed in this window differ depending on the product. For the items that can be displayed, refer to section 3, Debugging, or the online help.
4.15.2 On-Chip Break Function Setting of an on-chip breakpoint on channel 4 such that a break is triggered when the break condition has been satisfied five times is explained as an example of the use of on-chip breakpoints. Note: The channels on which the satisfaction count can be specified differ depending on the product. For details on each product, refer to section 3, Debugging, or the online help.
• Make the following settings in the group boxes on the [Address] page: Uncheck the [Don’t Care] checkbox. Then use the [Editor] window to refer to the address on the line that has ‘a[i]=j;’ within the tutorial function and enter this address in the [Address] edit box. In this example, enter H'0000107C. • Make the following settings in the boxes on the [Count] page: Uncheck the [Don’t Care] checkbox. Enter D’5 in the [Count] edit box. Note: The content of this dialog box differs depending on the product.
4.16 Trace Functions The trace functions of the emulator use the realtime trace buffer, which can store the information of up to 128-k bus cycles. The content of this buffer, which is constantly updated during execution, is displayed in the [Trace] window. Select [Trace] from the [Code] submenu of the [View] menu or click the [Trace] toolbar button ( the [Trace] window. ) to display Figure 4.
4.16.1 Displaying Trace Information by the Free Trace Function The free trace function allows continuous acquisition of trace information from the start of user program execution to the occurrence of a break. (1) All break conditions must be deleted. Clicking the right-hand mouse button on the [Trace] window displays a popup menu. Select [Acquisition…] from this menu to display the [Trace Acquisition Properties] dialog box. Ensure that [Free Trace] is checked and then click the [Close] button. Figure 4.
(2) Set a software breakpoint at the address on the line that has ‘p_sam->s0=a[0];’ within the tutorial function (refer to section 4.15.1, Software Break Function). (3) Select [Reset Go] from the [Debug] menu. Execution stops when the break condition is satisfied, and the [Trace] window then displays the trace information. Figure 4.
4.16.2 Displaying Trace Information by the Trace Stop Function While the trace stop function is in use, acquisition of trace information stops when a specified condition is satisfied. The user can check the program flow by the trace information without breaking the user program execution. (1) Delete all the break conditions that have been set. Uncheck [Free Trace] on the [Condition] page of the [Trace Acquisition Properties] dialog box (otherwise, the free trace mode will be selected).
(3) An address must be set as the condition. Uncheck [Don’t Care] on the [Address] page of the [Trace Acquisition Condition Channel 1] dialog box. Then use the [Editor] window to refer to the address on the line that includes ‘a[i]=j;’ within the tutorial function and enter this address in the [Start] edit box. In this example, enter H'0000107C. This completes the setting of the address. Click the [OK] button to close the [Trace Acquisition Condition Channel 1] dialog box. Figure 4.
(4) Items that have been set are displayed in the list box on the [Condition] page of the [Trace Acquisition Properties] dialog box. Click the [Close] button on this dialog box. Figure 4.43 [Trace Acquisition Properties] Dialog Box (Trace Stop) (5) Select [Reset Go] from the [Debug] menu. The trace condition is satisfied, and the [Trace] window then displays the following contents. Figure 4.
4.16.3 Displaying Trace Information by the Conditional Trace Function The conditional trace function only acquires trace information at the address where a specified condition has been satisfied. This is useful for analyzing a program focused on reading from or writing to a specific address (e.g. a global variable or memory mapped I/O). (1) If the user program is running, select [Halt Program] from the [Debug] menu to halt the program. (2) Delete all the break conditions that have been set.
4.16.4 Statistics The number of times the on-chip RAM has been written to can be included in the acquired trace information. (1) Delete all the break conditions that have been set. Click [Reset All] on the [Condition] page of the [Trace Acquisition Properties] dialog box to cancel trace conditions. Check [Free Trace] on the [Condition] page of the [Trace Acquisition Properties] dialog box.
(5) Select [R/W] in the [Item] combo box and enter WR in the [Start] edit box. Then, click the [New] button. “R/W=WR” will be displayed in the [Condition] column of the [Result] list box. Figure 4.
(6) Then, select [Area] from the [Item] combo box and enter RAM in the [Start] edit box. Then, click the [Add] button; the new condition is now added to the “R/W=WR” display in the [Condition] column of the [Result] list box, so that it now shows “R/W=WR & Area=RAM”. This completes the setting of the conditions. Figure 4.
(7) To start statistical analysis of the specified condition, press the [Result] button. The number of write operations that satisfies the conditions and the PTR values will be displayed. Figure 4.49 [Statistic] Dialog Box (Result of Analysis) (8) Click the [Close] button to close the [Statistic] dialog box. (9) Delete the event points that have been set and clear the trace information. Clicking the right-hand mouse button on the [Event] window displays a popup menu.
4.16.5 Function Calls This mechanism is only used to collect trace information on the function calls. (1) Make the setting so that a break occurs at the address on the line that has ‘p_sam->s0=a[0];’ within the tutorial function (H’000010A4 in this example) (for details, refer to section 4.15.1, Software Break Function). (2) Select [Reset Go] from the [Debug] menu. Execution stops when the break condition is satisfied, and the [Trace] window then displays the trace information.
4.17 Stack Trace Function The emulator uses the information on the stack to display the function call history. Notes: 1. This function can be used only when the load module that has the Dwarf2-type debugging information is loaded. Such load modules are supported in H8S, H8/300 C/C++ compiler V4.0 or later. 2. For details on the stack trace function, refer to the online help. • Double-click the [S/W Breakpoints] column in the sort function and set a software breakpoint. Figure 4.
• Select [Reset Go] from the [Debug] menu. • After the break in program execution, select [Stack Trace] from the [Code] submenu of the [View] menu to open the [Stack Trace] window. Figure 4.53 [Stack Trace] Window Figure 4.53 shows that the position of the program counter is currently at the selected line of the sort() function, and that the sort() function is called from the tutorial() function. To delete the software breakpoint, double-click the [S/W Breakpoints] column in the sort function again.
4.18 Performance Analysis Function Performance analysis by the emulator is available in the following modes: • Time Of Specified Range Measurement • Start Point To End Point Measurement • Start Range To End Range Measurement • Access Count Of Specified Range Measurement • Called Count Of Specified Range Measurement In this tutorial, we describe the Time Of Specified Range Measurement. 4.18.
(3) Select the line in the [Performance Analysis] window that has 1 in its [No] column and click the right-hand mouse button to display a popup menu. Select [Set…] from this popup menu to display the [Performance Analysis Properties] dialog box. Figure 4.56 [Performance Analysis Properties] Dialog Box (4)Select Time Of Specified Range Measurement from the [Measurement Method PA1] combo box. (5) The parameter settings are as follows. • Enter sort in the [Range Name] edit box.
Note: The addresses figured out in the [Input Function Range] dialog box are just for reference. In some cases, the end address of a function may be incorrect. Check the last instruction of the function in the [Disassembly] window to correct the value set in [End Address] so that it will be the address of the last instruction (in general, the last instruction of a function is a RTS instruction).
4.19 Monitor Function The emulator allows monitoring of the contents of specified addresses in memory during execution of the user program. In this example, we monitor the content of the address range where variable a of the tutorial function is stored. (1) Select the [CPU] submenu from the [View] menu. Selecting [Monitor Setting…] from the [Monitor] submenu displays the [Monitor Setting] dialog box. Figure 4.
(2) Set the items in the [Monitor Setting] dialog box as follows: • Enter monitor1 in the [Name] edit box. • Set the parameters in the [Options] group box as follows: (a) Use the [Watch] window to refer to the address on the line where variable a, which is defined within the tutorial function, is allocated and enter this address in the [Address] edit box. In this example, H’FFFFE400 is entered. (b) Enter H’20 in the [Size (byte)] combo box. (c) Select BYTE (ASCII) from the [Access (Format)] combo box.
(3) Click the [OK] button to open the [Monitor] window. Figure 4.62 [Monitor] Window (4) Select [Reset Go] from the [Debug] menu. When the contents of the address range changes by execution, the updated values are in red (i.e. the color that was selected in the [Foreground] and [Background] combo boxes). Values will be displayed in black if they have not been updated or a certain period of time has elapsed since the last update. Figure 4.
132
Section 5 Software Specifications and Notes Specific to This Product This section describes the software specifications and notes specific to the E6000H emulator. 5.1 Supported Hardware This emulator software is specialized for the SH7046 E6000H emulator (HS7046EPH60H). 5.2 Debugging Platform The following debugging platform can be selected in this emulator. The target MCUs to be emulated depend on the selected debugging platform. Table 5.
Notes: 1. If the setting in the [Watch] window allows a realtime update of a value by reading the normal data, access types will be different depending on the target memory area that has been set. 2. The parallel access or short break function cannot be used to display or modify the memory contents while in the sleep mode or standby mode. 3. When the parallel access function or short break function is in use, the program is not executed in realtime. 5.3.
5.4 Executing Your Program 5.4.1 Step Execution Break conditions are ignored during step execution, but trigger pulses will be output. 5.5 Event Functions 5.5.1 Software Breakpoints • A software breakpoint is realized by replacing the instruction at the specified address with a special instruction. Accordingly, it can only be set to the area including the emulation RAM.
5.5.3 On-Emulator Break • A break will occur several cycles after a condition is satisfied. • The address bus and data bus conditions are satisfied on the bus cycles where the values on the address bus or data bus match. Consider the following points when setting these conditions. ⎯ 32-bit bus area • Longword access Longword data is read and written in a single bus cycle. A data condition is only valid for a longword access when specified as longword.
5.6 5.6.1 Trace Functions Displaying the Trace Information • The same hardware resource is used for acquisition of time stamps and the IRQ signals in the trace function. Accordingly, the trace contents differ depending on the [Selection of the trace contents] setting in the [Trace Acquisition Properties] dialog box. Table 5.7 Trace Contents Setting Description When [Timestamp] is selected Acquires and displays timestamp in 32 bits. The IRQ signals are not acquired.
5.7 Monitor Function The foreground and background colors cannot be changed in some operating systems. 5.8 5.8.1 Performance Analysis Function Errors An error will be included in the measured performance as follows: • ±one-resolution error (±20-ns error when the measurement resolution is 20 ns) This error may occur when the user program execution starts or stops (breaks) or when the measurement start or end condition is satisfied.
5.9 Profiling Function • If there is no stack information file (extension is ‘.sni’) that is output from the optimizing linkage editor, only the functions that have been executed during the profiling data measurement are displayed. For details of the stack information file, refer to the manual of the optimizing linkage editor. • The stack size differs from the actual value. It should be used as a reference value during a function call. If there is no stack information file (extension is ‘.
5.11 Tutorial Program 5.11.1 Notes on Operating the Tutorial Program To operate the High-performance Embedded Workshop according to the description of section 4, Tutorial, the following procedures must be added or modified. Table 5.11 Notes on Operating the Tutorial Program 4.6 Executing the Program Reset the target MCU before executing the program. Refer to section 4.14, Resetting the Target MCU for how to reset the target MCU. 4.12.
Memory map for on-chip ROM invalid mode H'00000000 (2M) H'001FFFFF H'00200000 (2M) H'003FFFFF H'00000000 CS0 CS0 SB0 (128K) H'0001FFFF H'00020000 LB0 H'00200000 (1M) H'002FFFFF SB1 (128K) H'0003FFFF LB1 H'00300000 (1M) H'003FFFFF SB2 H'00040000 (128K) H'0005FFFF SB3 H'00060000 (128K) H'0007FFFF H'00400000 H'00400000 LB2 (4M) CS1 H'00500000 LB3 LB5 H'00700000 (1M) H'007FFFFF SB6 LB6 H'00800000 (1M) H'008FFFFF SB7 LB8 H'00BFFFFF H'00C00000 LB9 CS3 (1M) H'009FFFFF H'00A00000 (1M) H'00
Memory map for on-chip ROM valid mode H'00000000 (1M) H'000FFFFF H'00100000 (2M) H'001FFFFF H'00200000 (2M) H'003FFFFF On-chip ROM Reserved SB0 CS0 SB1 H'00400000 SB2 H'00400000 LB2 (1M) H'004FFFFF (4M) CS1 LB3 LB4 H'007FFFFF H'00800000 LB5 LB6 (4M) CS2 LB7 H'00500000 (1M) H'005FFFFF H'00600000 (1M) H'006FFFFF H'00700000 (1M) H'007FFFFF H'00800000 (1M) H'008FFFFF H'00900000 (1M) H'009FFFFF H'00A00000 LB8 (1M) H'00BFFFFF H'00C00000 (4M) H'00FFFFFF H'01000000 CS3 H'00AFFFFF H'00B00000 LB9 (1M)
Section 6 Error Messages 6.1 6.1.1 Error Messages of the Emulator Error Messages at Emulator Initiation The emulator displays error messages in the format below if an error occurs at emulator initiation in the dedicated message dialog box when the High-performance Embedded Workshop is used. Table 6.1 lists error messages at emulator initiation.
Table 6.1 Error Messages at Initiation Error Message Description and Solution There is no configuration file. The configuration file that is required to initiate the emulator cannot be found. Exit and re-install the High-performance Embedded Workshop. Then re-connect the user system interface cable, turn on the power of the emulator, and reinitiate the High-performance Embedded Workshop. If the problem is not solved, contact us and describe the error occurrence in detail.
Table 6.1 Error Messages at Initiation (cont) Error Message Description and Solution Can’t find firmware file There is an error in the file that is required at emulator initiation. Exit the High-performance Embedded Workshop, re-connect the user system interface cable, turn on the power of the emulator, and re-initiate the High-performance Embedded Workshop. If the problem is not solved, contact us and describe the error occurrence in detail.
146
Appendix A Menus Table A.1 shows GUI menus. Table A.1 GUI Menus Toolbar Button Menu Option Shortcut View Command Line Ctrl + L Opens the [Command Line] window. Workspace Alt + K Opens the [Workspace] window. Output Alt + U Opens the [Output] window. Disassembly Ctrl + D Opens the [Disassembly] window. CPU Registers Ctrl + R Opens the [Register] window. Memory… Ctrl + M Opens the [Memory] window. IO Ctrl + I Opens the [IO] window. Status Ctrl + U Opens the [Status] window.
Table A.1 GUI Menus (cont) Menu Option View (cont) Graphic Performance Shortcut Toolbar Button Remarks Image… Shift + Ctrl + G Opens the [Image] window. Waveform… Shift + Ctrl + V Opens the [Waveform] window. Performance Analysis Shift + Ctrl + P Opens the [Performance Analysis] window. Profile Shift + Ctrl + F Opens the [Profile] window. Option Debug Debug Sessions… Opens the [Debug Sessions] dialog box to list, add, or remove the debug session.
Table A.1 GUI Menus (cont) Toolbar Button Menu Option Shortcut Debug (cont) Step In F11 Executes a block of user program before breaking. Step Over F10 Executes a block of user program before breaking. If a subroutine call is reached, then the subroutine will not be entered. Step Out Shift + F11 Executes the user program to reach the end of the current function. Step… Step Mode Remarks Launches the [Step Program] dialog box allowing the user to modify the settings for stepping.
Table A.1 GUI Menus (cont) Option Setup Customize… Customize the Highperformance Embedded Workshop application. Options… Sets option of the Highperformance Embedded Workshop application. Format Views… Configure fonts, colors, keywords and so on, for the window. Radix Hexadecimal Uses a hexadecimal for displaying a radix in which the numerical values will be displayed and entered by default.
Appendix B Command Lines Table B.1 lists the High-performance Embedded Workshop commands. Table B.1 High-performance Embedded Workshop Commands No.
Table B.1 High-performance Embedded Workshop Commands (cont) No.
Table B.1 High-performance Embedded Workshop Commands (cont) No.
Table B.1 High-performance Embedded Workshop Commands (cont) No.
Renesas Microcomputer Development Environment System User's Manual SH7046 E6000H Emulator Publication Date: Rev.4.00, October 21, 2005 Published by: Sales Strategic Planning Div. Renesas Technology Corp. Edited by: Customer Support Department Global Strategic Communication Div. Renesas Solutions Corp. © 2005. Renesas Technology Corp., All rights reserved. Printed in Japan.
Sales Strategic Planning Div. Nippon Bldg., 2-6-2, Ohte-machi, Chiyoda-ku, Tokyo 100-0004, Japan RENESAS SALES OFFICES http://www.renesas.com Refer to "http://www.renesas.com/en/network" for the latest and detailed information. Renesas Technology America, Inc. 450 Holger Way, San Jose, CA 95134-1368, U.S.
SH7046 E6000H Emulator User’s Manual