
User`s manual

SuperH Family E10A-USB Emulator Section 5 Debugging
R20UT0870EJ1000 Rev. 10.00 Page 174 of 292
Aug 10, 2012
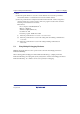
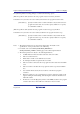
5.8.9 [Profile-Chart] Window
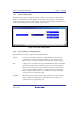
The [Profile-Chart] window displays the relation of calls for a specific function. This window
displays the specified function in the middle, with the callers of the function on the left and the
callees of the function on the right. The numbers of times the function calls the called functions or
is called by the calling functions are also displayed in this window.
Figure 5.46 [Profile-Chart] Window
5.8.10 Types and Purposes of Displayed Data
The profile function is able to acquire the following information:
Address You can see the locations in memory to which the functions are allocated.
Sorting the list of functions and global variables in order of their addresses
allows the user to view the way the items are allocated in the memory space.
Size Sorting in order of size makes it easy to find small functions that are frequently
called. Setting such functions as inline may reduce the overhead of function
calls. If you are using a microcomputer which incorporates a cache memory,
more of the cache memory will need to be updated when you execute larger
functions. This information allows you to check if those functions that may
cause cache misses are frequently called.
Stack Size When there is deep nesting of function calls, pursue the route of the function
calls and obtain the total stack size for all of the functions on that route to
estimate the amount of stack being used.