
User`s manual

SuperH Family E10A-USB Emulator Section 5 Debugging
R20UT0870EJ1000 Rev. 10.00 Page 171 of 292
Aug 10, 2012
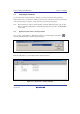
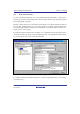
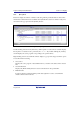
5.8.8 [Tree] Sheet
This sheet displays the relation of function calls along with the profile data that are values when
the function is called. This sheet is available when [Disable Tree (Not traces function call)] is not
selected from the pop-up menu in the [Profile] window.
Figure 5.44 [Tree] Sheet
Double-clicking a function in the [Function] column expands or reduces the tree structure display.
The expansion or reduction is also provided by the “+” or “-“ key. Double-clicking the [Address]
column displays the source program corresponding to the specific address.
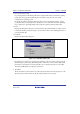
Right-clicking on the mouse within the window displays a pop-up menu. Supported menu options
are described in the following:
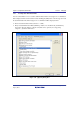
View Source
Displays the source program or disassembled memory contents for the address in the selected
line.
View Profile-Chart
Displays the [Profile-Chart] window focused on the function in the specified line.
Enable Profiler
Toggles acquisition profile data. When profile data acquisition is active, a check mark is
shown to the left of the menu text.