
User`s manual

SuperH Family E10A-USB Emulator Section 5 Debugging
R20UT0870EJ1000 Rev. 10.00 Page 133 of 292
Aug 10, 2012
5.6 Viewing the Trace Information
For the description on the trace function, refer to section 2.2, Trace Functions.
5.6.1 Opening the [Trace] Window
To open the [Trace] window, choose [View -> Code -> Trace] or click the [Trace] toolbar button
(
).
5.6.2 Acquiring Trace Information
When the emulator does not set the acquisition condition of the trace information, the trace
information is acquired by the internal trace function in default.
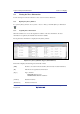
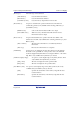
The acquired trace information is displayed in the [Trace] window.
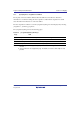
Figure 5.17 [Trace] Window (Type 1) (Internal Trace)
This window displays the following trace information items:
[PTR] Pointer to a location in the trace buffer (+0 for the last executed instruction)
[IP] The amount of acquired trace information
[Type] Type of branch:
BRANCH: Branch source
DESTINATION: Branch destination
[Address] Instruction address
[Instruction] Instruction mnemonic