
User`s manual
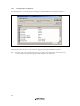
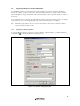


Table Of Contents
- Cover
- Keep safety first in your circuit designs!
- Notes regarding these materials
- IMPORTANT INFORMATION
- SAFETY PAGE
- Introduction
- About This Manual
- Contents
- Emulator Debugger Part
- Section 1 Overview
- Section 2 Preparation before Use
- Section 3 E6000 Emulator Functions
- Section 4 Preparation before Use
- Section 5 Debugging
- 5.1 Setting the Environment for Emulation
- 5.2 Downloading a Program
- 5.3 Viewing the Current Status
- 5.4 Reading and Displaying the Emulator Information Regularly
- 5.5 Displaying Memory Contents in Realtime
- 5.6 Viewing the Variables
- 5.7 Using the Event Points
- 5.7.1 Software Breakpoints
- 5.7.2 Event Points
- 5.7.3 Event Detection System
- 5.7.4 Signals to Indicate Bus States and Areas
- 5.7.5 Opening the [Event] Window
- 5.7.6 Setting Software Breakpoints
- 5.7.7 Setting Event Points
- 5.7.8 Setting Trigger Points
- 5.7.9 Editing Event Points
- 5.7.10 Modifying Event Points
- 5.7.11 Enabling an Event Point
- 5.7.12 Disabling an Event Point
- 5.7.13 Deleting an Event Point
- 5.7.14 Deleting All Event Points
- 5.7.15 Viewing the Source Line for an Event Point
- 5.8 Viewing the Trace Information
- 5.8.1 Opening the [Trace] Window
- 5.8.2 Acquiring Trace Information
- 5.8.3 Specifying Trace Acquisition Conditions
- 5.8.4 Searching for a Trace Record
- 5.8.5 Clearing the Trace Information
- 5.8.6 Saving the Trace Information in a File
- 5.8.7 Viewing the [Editor] Window
- 5.8.8 Trimming the Source
- 5.8.9 Acquiring a Snapshot of the Trace Information
- 5.8.10 Temporarily Stopping Trace Acquisition
- 5.8.11 Restarting Trace Acquisition
- 5.8.12 Extracting Records from the Acquired Information
- 5.8.13 Calculating the Difference in Time Stamping
- 5.8.14 Analyzing Statistical Information
- 5.8.15 Extracting Function Calls from the Acquired Trace Information
- 5.9 Analyzing Performance
- Section 6 Tutorial
- 6.1 Introduction
- 6.2 Running the High-performance Embedded Workshop
- 6.3 Downloading the Tutorial Program
- 6.4 Setting a Software Breakpoint
- 6.5 Setting Registers
- 6.6 Executing the Program
- 6.7 Reviewing Breakpoints
- 6.8 Referring to Symbols
- 6.9 Viewing Memory
- 6.10 Watching Variables
- 6.11 Displaying Local Variables
- 6.12 Stepping Through a Program
- 6.13 Forced Breaking of Program Executions
- 6.14 Resetting the MCU
- 6.15 Break Function
- 6.16 Trace Functions
- 6.17 Stack Trace Function
- 6.18 Performance Measurement Function
- 6.19 Monitor Function
- 6.20 What Next?
- Section 7 Hardware Specifications Specific to This Product
- 7.1 H8/3800 E6000 Emulator Specifications
- 7.2 User System Interface of H8/3800 E6000 Emulator
- 7.3 Differences between MCU and H8/3800 E6000 Emulator
- 7.4 Handling Evaluation Chip Board (HS3800EBK61H)
- 7.5 Host PC Interface (only for HS38000EPI61H + HS3800EBK61H)
- 7.6 H8/388R E6000 Emulator Specifications
- 7.7 User System Interface of H8/388R E6000 Emulator
- 7.8 Differences between MCU and H8/388R E6000 Emulator
- 7.9 Handling Evaluation Chip Board (HS388REBK61H)
- 7.10 Host PC Interface (only for HS38000EPI61H + HS388REBK61H)
- Section 8 Software Specifications Specific to This Product
- 8.1 Software Specifications of the H8/3800 E6000 Emulator
- 8.1.1 Target Hardware
- 8.1.2 Selectable Platform
- 8.1.3 [Configuration Properties] Dialog Box ([General] Page)
- 8.1.4 Memory Mapping Function
- 8.1.5 [Status] Window
- 8.1.6 Extended Monitor Function
- 8.1.7 Signals to Indicate Bus States and Areas
- 8.1.8 Monitoring Function
- 8.1.9 Trigger Points
- 8.1.10 Trace Information
- 8.1.11 Searching for a Trace Record
- 8.1.12 Trace Filtering Function
- 8.2 Note on Usage of the H8/3800 E6000 Emulator
- 8.3 Software Specifications of the H8/388R E6000 Emulator
- 8.3.1 Target Hardware
- 8.3.2 Selectable Platforms
- 8.3.3 [Configuration Properties] Dialog Box ([General] Page)
- 8.3.4 Memory Mapping Function
- 8.3.5 [Status] Window
- 8.3.6 Extended Monitor Function
- 8.3.7 Signals to Indicate Bus States and Areas
- 8.3.8 Monitoring Function
- 8.3.9 Trigger Points
- 8.3.10 Trace Information
- 8.3.11 Searching for a Trace Record
- 8.3.12 Trace Filtering Function
- 8.4 Note on Usage of the H8/388R E6000 Emulator
- 8.5 Performance Analysis Function
- 8.1 Software Specifications of the H8/3800 E6000 Emulator
- Appendix A I/O File Format
- Appendix B Menus
- Appendix C Command Lines
- Appendix D Diagnostic Test Procedure
- Colophon

54
[Name]: Decides the name of the monitor window.
[Options]: Sets monitor conditions.
[Address]: Sets the start address for monitoring.
[Size]: Sets the range for monitoring.
[Access]: Sets the access size to be displayed in the monitor window.
[Auto-Refresh at rate (ms)]: Sets the interval for acquisition by monitoring (500 ms at minimum).
[Reading the Initial Value]: Selects reading of the values in the monitored area when the monitor
window is opened.
[Color]: Sets the method to update monitoring and the attribute of colors.
[Change Indicator]: Selects how to display the values that have changed during monitoring
(available when [Reading the Initial Value] has been selected).
No change: No color change.
Change: Color is changed according to the [Foreground] and [Background]
options.
Gray: Those data with values that have not been changed are displayed in
gray.
Appear: A value is only displayed after changed.
[Foreground]: Sets the color used for display (available when [Change] has been selected).
[Background]: Sets the background color (available when [Change] has been selected).
[Mayfly]: A check in this box selects restoration of the color of those data which have
not been updated in a specified interval to the color selected in the
[Background] option. The specified interval is the interval for monitor
acquisition (available when [Change], [Gray], or [Appear] has been selected).
[Detail]: Sets the items specific to the emulator. Not used with this emulator.
[History]: Displays the previous settings.
Notes: 1. In this emulator, odd addressees cannot be specified as the start addresses for monitoring.
2. Selection of the foreground or background color may not be available depending on the operating
system in use.
After setting, clicking the [OK] button displays the [Monitor] window.