
User`s manual
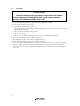


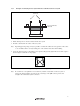
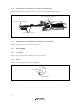

Table Of Contents
- Cover
- Keep safety first in your circuit designs!
- Notes regarding these materials
- IMPORTANT INFORMATION
- SAFETY PAGE
- Introduction
- About This Manual
- Contents
- Emulator Debugger Part
- Section 1 Overview
- Section 2 Preparation before Use
- Section 3 E6000 Emulator Functions
- Section 4 Preparation before Use
- Section 5 Debugging
- 5.1 Setting the Environment for Emulation
- 5.2 Downloading a Program
- 5.3 Viewing the Current Status
- 5.4 Reading and Displaying the Emulator Information Regularly
- 5.5 Displaying Memory Contents in Realtime
- 5.6 Viewing the Variables
- 5.7 Using the Event Points
- 5.7.1 Software Breakpoints
- 5.7.2 Event Points
- 5.7.3 Event Detection System
- 5.7.4 Signals to Indicate Bus States and Areas
- 5.7.5 Opening the [Event] Window
- 5.7.6 Setting Software Breakpoints
- 5.7.7 Setting Event Points
- 5.7.8 Setting Trigger Points
- 5.7.9 Editing Event Points
- 5.7.10 Modifying Event Points
- 5.7.11 Enabling an Event Point
- 5.7.12 Disabling an Event Point
- 5.7.13 Deleting an Event Point
- 5.7.14 Deleting All Event Points
- 5.7.15 Viewing the Source Line for an Event Point
- 5.8 Viewing the Trace Information
- 5.8.1 Opening the [Trace] Window
- 5.8.2 Acquiring Trace Information
- 5.8.3 Specifying Trace Acquisition Conditions
- 5.8.4 Searching for a Trace Record
- 5.8.5 Clearing the Trace Information
- 5.8.6 Saving the Trace Information in a File
- 5.8.7 Viewing the [Editor] Window
- 5.8.8 Trimming the Source
- 5.8.9 Acquiring a Snapshot of the Trace Information
- 5.8.10 Temporarily Stopping Trace Acquisition
- 5.8.11 Restarting Trace Acquisition
- 5.8.12 Extracting Records from the Acquired Information
- 5.8.13 Calculating the Difference in Time Stamping
- 5.8.14 Analyzing Statistical Information
- 5.8.15 Extracting Function Calls from the Acquired Trace Information
- 5.9 Analyzing Performance
- Section 6 Tutorial
- 6.1 Introduction
- 6.2 Running the High-performance Embedded Workshop
- 6.3 Downloading the Tutorial Program
- 6.4 Setting a Software Breakpoint
- 6.5 Setting Registers
- 6.6 Executing the Program
- 6.7 Reviewing Breakpoints
- 6.8 Referring to Symbols
- 6.9 Viewing Memory
- 6.10 Watching Variables
- 6.11 Displaying Local Variables
- 6.12 Stepping Through a Program
- 6.13 Forced Breaking of Program Executions
- 6.14 Resetting the MCU
- 6.15 Break Function
- 6.16 Trace Functions
- 6.17 Stack Trace Function
- 6.18 Performance Measurement Function
- 6.19 Monitor Function
- 6.20 What Next?
- Section 7 Hardware Specifications Specific to This Product
- 7.1 H8/3800 E6000 Emulator Specifications
- 7.2 User System Interface of H8/3800 E6000 Emulator
- 7.3 Differences between MCU and H8/3800 E6000 Emulator
- 7.4 Handling Evaluation Chip Board (HS3800EBK61H)
- 7.5 Host PC Interface (only for HS38000EPI61H + HS3800EBK61H)
- 7.6 H8/388R E6000 Emulator Specifications
- 7.7 User System Interface of H8/388R E6000 Emulator
- 7.8 Differences between MCU and H8/388R E6000 Emulator
- 7.9 Handling Evaluation Chip Board (HS388REBK61H)
- 7.10 Host PC Interface (only for HS38000EPI61H + HS388REBK61H)
- Section 8 Software Specifications Specific to This Product
- 8.1 Software Specifications of the H8/3800 E6000 Emulator
- 8.1.1 Target Hardware
- 8.1.2 Selectable Platform
- 8.1.3 [Configuration Properties] Dialog Box ([General] Page)
- 8.1.4 Memory Mapping Function
- 8.1.5 [Status] Window
- 8.1.6 Extended Monitor Function
- 8.1.7 Signals to Indicate Bus States and Areas
- 8.1.8 Monitoring Function
- 8.1.9 Trigger Points
- 8.1.10 Trace Information
- 8.1.11 Searching for a Trace Record
- 8.1.12 Trace Filtering Function
- 8.2 Note on Usage of the H8/3800 E6000 Emulator
- 8.3 Software Specifications of the H8/388R E6000 Emulator
- 8.3.1 Target Hardware
- 8.3.2 Selectable Platforms
- 8.3.3 [Configuration Properties] Dialog Box ([General] Page)
- 8.3.4 Memory Mapping Function
- 8.3.5 [Status] Window
- 8.3.6 Extended Monitor Function
- 8.3.7 Signals to Indicate Bus States and Areas
- 8.3.8 Monitoring Function
- 8.3.9 Trigger Points
- 8.3.10 Trace Information
- 8.3.11 Searching for a Trace Record
- 8.3.12 Trace Filtering Function
- 8.4 Note on Usage of the H8/388R E6000 Emulator
- 8.5 Performance Analysis Function
- 8.1 Software Specifications of the H8/3800 E6000 Emulator
- Appendix A I/O File Format
- Appendix B Menus
- Appendix C Command Lines
- Appendix D Diagnostic Test Procedure
- Colophon
11
2.5.6 Voltage Follower Circuit
CAUTION
1. Do not connect the user system interface cable to the emulator
without user system connection.
2. Turn on the user system before starting up the emulator.
A voltage follower circuit is implemented on the emulator which allows the user system voltage level from the
user system to be monitored. This monitored voltage level is automatically supplied to the logic on the emulator
and is derived from the emulator power supply unit. This means that no power is taken from the user system
board.
If no user system interface cable is connected to the emulator, the emulator will operate at a specified voltage
and all clock frequencies will be available to the user. If the user system interface cable is attached, the emulator
will match the voltage supplied to the user target in all cases; i.e. even when the user V
CC
is below the operating
voltage for the MCU. You must be careful not to select an invalid clock frequency. When the emulator is
connected to the user system and the user system is turned off, the voltage follower circuit output voltage level is
0 V. In this case, the emulator will not operate correctly.
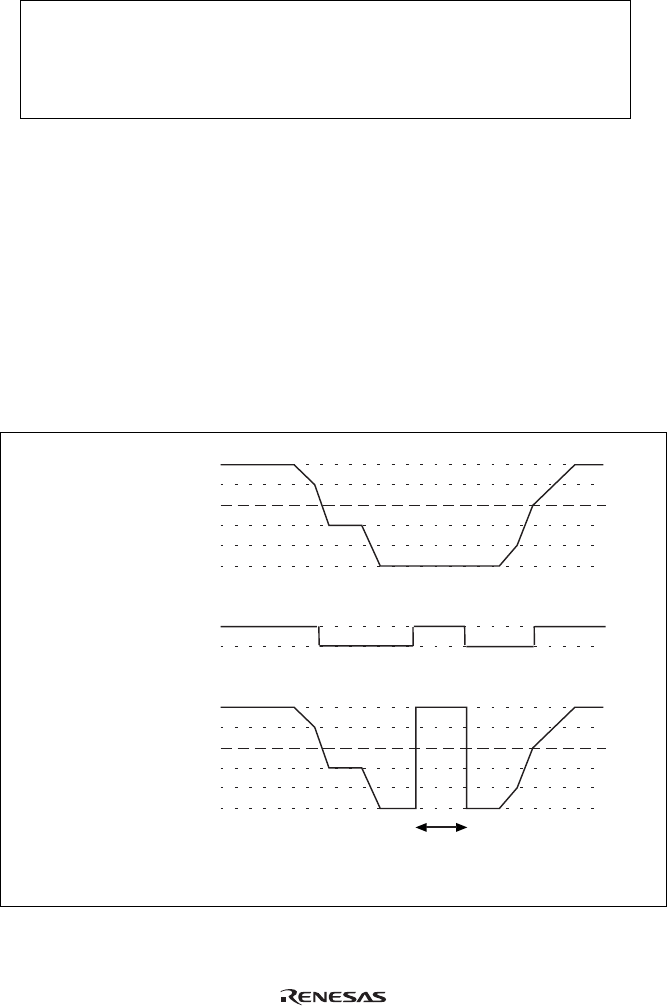
You can set a user V
CC
threshold in the range Vcc max. – 0 V by using the emulator configuration dialog box. If
the user V
CC
drops below this threshold, [User System Voltage] in the [Extended Monitor] window will display
Down, otherwise OK is displayed.
User
threshold
User Vcc
threshold
The user system interface
cable is not connected.
User Vcc level
E6000
Vcc level
3.3 V
0 V
OK
Down
3.3 V
0 V
Figure 2.11 Voltage Level Monitoring (Example for Vcc = 3.3 V)