
User`s manual


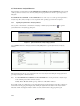

Table Of Contents
- Cover
- Keep safety first in your circuit designs!
- Notes regarding these materials
- IMPORTANT INFORMATION
- SAFETY PAGE
- Introduction
- About This Manual
- Contents
- Emulator Debugger Part
- Section 1 Overview
- Section 2 Preparation before Use
- Section 3 E6000 Emulator Functions
- Section 4 Preparation before Use
- Section 5 Debugging
- 5.1 Setting the Environment for Emulation
- 5.2 Downloading a Program
- 5.3 Viewing the Current Status
- 5.4 Reading and Displaying the Emulator Information Regularly
- 5.5 Displaying Memory Contents in Realtime
- 5.6 Viewing the Variables
- 5.7 Using the Event Points
- 5.7.1 Software Breakpoints
- 5.7.2 Event Points
- 5.7.3 Event Detection System
- 5.7.4 Signals to Indicate Bus States and Areas
- 5.7.5 Opening the [Event] Window
- 5.7.6 Setting Software Breakpoints
- 5.7.7 Setting Event Points
- 5.7.8 Setting Trigger Points
- 5.7.9 Editing Event Points
- 5.7.10 Modifying Event Points
- 5.7.11 Enabling an Event Point
- 5.7.12 Disabling an Event Point
- 5.7.13 Deleting an Event Point
- 5.7.14 Deleting All Event Points
- 5.7.15 Viewing the Source Line for an Event Point
- 5.8 Viewing the Trace Information
- 5.8.1 Opening the [Trace] Window
- 5.8.2 Acquiring Trace Information
- 5.8.3 Specifying Trace Acquisition Conditions
- 5.8.4 Searching for a Trace Record
- 5.8.5 Clearing the Trace Information
- 5.8.6 Saving the Trace Information in a File
- 5.8.7 Viewing the [Editor] Window
- 5.8.8 Trimming the Source
- 5.8.9 Acquiring a Snapshot of the Trace Information
- 5.8.10 Temporarily Stopping Trace Acquisition
- 5.8.11 Restarting Trace Acquisition
- 5.8.12 Extracting Records from the Acquired Information
- 5.8.13 Calculating the Difference in Time Stamping
- 5.8.14 Analyzing Statistical Information
- 5.8.15 Extracting Function Calls from the Acquired Trace Information
- 5.9 Analyzing Performance
- Section 6 Tutorial
- 6.1 Introduction
- 6.2 Running the High-performance Embedded Workshop
- 6.3 Downloading the Tutorial Program
- 6.4 Setting a Software Breakpoint
- 6.5 Setting Registers
- 6.6 Executing the Program
- 6.7 Reviewing Breakpoints
- 6.8 Referring to Symbols
- 6.9 Viewing Memory
- 6.10 Watching Variables
- 6.11 Displaying Local Variables
- 6.12 Stepping Through a Program
- 6.13 Forced Breaking of Program Executions
- 6.14 Resetting the MCU
- 6.15 Break Function
- 6.16 Trace Functions
- 6.17 Stack Trace Function
- 6.18 Performance Measurement Function
- 6.19 Monitor Function
- 6.20 What Next?
- Section 7 Hardware Specifications Specific to This Product
- 7.1 H8/3800 E6000 Emulator Specifications
- 7.2 User System Interface of H8/3800 E6000 Emulator
- 7.3 Differences between MCU and H8/3800 E6000 Emulator
- 7.4 Handling Evaluation Chip Board (HS3800EBK61H)
- 7.5 Host PC Interface (only for HS38000EPI61H + HS3800EBK61H)
- 7.6 H8/388R E6000 Emulator Specifications
- 7.7 User System Interface of H8/388R E6000 Emulator
- 7.8 Differences between MCU and H8/388R E6000 Emulator
- 7.9 Handling Evaluation Chip Board (HS388REBK61H)
- 7.10 Host PC Interface (only for HS38000EPI61H + HS388REBK61H)
- Section 8 Software Specifications Specific to This Product
- 8.1 Software Specifications of the H8/3800 E6000 Emulator
- 8.1.1 Target Hardware
- 8.1.2 Selectable Platform
- 8.1.3 [Configuration Properties] Dialog Box ([General] Page)
- 8.1.4 Memory Mapping Function
- 8.1.5 [Status] Window
- 8.1.6 Extended Monitor Function
- 8.1.7 Signals to Indicate Bus States and Areas
- 8.1.8 Monitoring Function
- 8.1.9 Trigger Points
- 8.1.10 Trace Information
- 8.1.11 Searching for a Trace Record
- 8.1.12 Trace Filtering Function
- 8.2 Note on Usage of the H8/3800 E6000 Emulator
- 8.3 Software Specifications of the H8/388R E6000 Emulator
- 8.3.1 Target Hardware
- 8.3.2 Selectable Platforms
- 8.3.3 [Configuration Properties] Dialog Box ([General] Page)
- 8.3.4 Memory Mapping Function
- 8.3.5 [Status] Window
- 8.3.6 Extended Monitor Function
- 8.3.7 Signals to Indicate Bus States and Areas
- 8.3.8 Monitoring Function
- 8.3.9 Trigger Points
- 8.3.10 Trace Information
- 8.3.11 Searching for a Trace Record
- 8.3.12 Trace Filtering Function
- 8.4 Note on Usage of the H8/388R E6000 Emulator
- 8.5 Performance Analysis Function
- 8.1 Software Specifications of the H8/3800 E6000 Emulator
- Appendix A I/O File Format
- Appendix B Menus
- Appendix C Command Lines
- Appendix D Diagnostic Test Procedure
- Colophon

209
8.4 Note on Usage of the H8/388R E6000 Emulator
There is the following note on usage of the emulator.
8.4.1 Environment for Execution of the Tutorial Program
To execute the tutorial program, specify “Tutorial.hws” stored in the following directory:
OS installation drive \Workspace\Tutorial\E6000\388R
The directory mentioned above cannot be specified depending on the version of the software. In such cases,
specify the following directory instead.
High-performance Embedded Workshop installation destination directory
\Tools\Renesas\DebugComp\Platform\E6000\388R\Tutorial
8.4.2 Sub-Clock Operation
For the H8/3887 group, H8/3847 group, H8/3867 group, H8/3827 group, H8/3847R group, or H8/3827R group
MCU, 307.2 kHz cannot be selected as the internal sub-clock (φw). This is because the emulator operation and
display become slow when a break is detected while the sub-clock (32.768 kHz or 38.4 kHz) is in use. Therefore,
when evaluating by using the sub-clock, select 307.2 kHz that is the eight times the frequency of 38.4 kHz.