
User`s manual


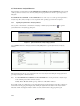

Table Of Contents
- Cover
- Keep safety first in your circuit designs!
- Notes regarding these materials
- IMPORTANT INFORMATION
- SAFETY PAGE
- Introduction
- About This Manual
- Contents
- Emulator Debugger Part
- Section 1 Overview
- Section 2 Preparation before Use
- Section 3 E6000 Emulator Functions
- Section 4 Preparation before Use
- Section 5 Debugging
- 5.1 Setting the Environment for Emulation
- 5.2 Downloading a Program
- 5.3 Viewing the Current Status
- 5.4 Reading and Displaying the Emulator Information Regularly
- 5.5 Displaying Memory Contents in Realtime
- 5.6 Viewing the Variables
- 5.7 Using the Event Points
- 5.7.1 Software Breakpoints
- 5.7.2 Event Points
- 5.7.3 Event Detection System
- 5.7.4 Signals to Indicate Bus States and Areas
- 5.7.5 Opening the [Event] Window
- 5.7.6 Setting Software Breakpoints
- 5.7.7 Setting Event Points
- 5.7.8 Setting Trigger Points
- 5.7.9 Editing Event Points
- 5.7.10 Modifying Event Points
- 5.7.11 Enabling an Event Point
- 5.7.12 Disabling an Event Point
- 5.7.13 Deleting an Event Point
- 5.7.14 Deleting All Event Points
- 5.7.15 Viewing the Source Line for an Event Point
- 5.8 Viewing the Trace Information
- 5.8.1 Opening the [Trace] Window
- 5.8.2 Acquiring Trace Information
- 5.8.3 Specifying Trace Acquisition Conditions
- 5.8.4 Searching for a Trace Record
- 5.8.5 Clearing the Trace Information
- 5.8.6 Saving the Trace Information in a File
- 5.8.7 Viewing the [Editor] Window
- 5.8.8 Trimming the Source
- 5.8.9 Acquiring a Snapshot of the Trace Information
- 5.8.10 Temporarily Stopping Trace Acquisition
- 5.8.11 Restarting Trace Acquisition
- 5.8.12 Extracting Records from the Acquired Information
- 5.8.13 Calculating the Difference in Time Stamping
- 5.8.14 Analyzing Statistical Information
- 5.8.15 Extracting Function Calls from the Acquired Trace Information
- 5.9 Analyzing Performance
- Section 6 Tutorial
- 6.1 Introduction
- 6.2 Running the High-performance Embedded Workshop
- 6.3 Downloading the Tutorial Program
- 6.4 Setting a Software Breakpoint
- 6.5 Setting Registers
- 6.6 Executing the Program
- 6.7 Reviewing Breakpoints
- 6.8 Referring to Symbols
- 6.9 Viewing Memory
- 6.10 Watching Variables
- 6.11 Displaying Local Variables
- 6.12 Stepping Through a Program
- 6.13 Forced Breaking of Program Executions
- 6.14 Resetting the MCU
- 6.15 Break Function
- 6.16 Trace Functions
- 6.17 Stack Trace Function
- 6.18 Performance Measurement Function
- 6.19 Monitor Function
- 6.20 What Next?
- Section 7 Hardware Specifications Specific to This Product
- 7.1 H8/3800 E6000 Emulator Specifications
- 7.2 User System Interface of H8/3800 E6000 Emulator
- 7.3 Differences between MCU and H8/3800 E6000 Emulator
- 7.4 Handling Evaluation Chip Board (HS3800EBK61H)
- 7.5 Host PC Interface (only for HS38000EPI61H + HS3800EBK61H)
- 7.6 H8/388R E6000 Emulator Specifications
- 7.7 User System Interface of H8/388R E6000 Emulator
- 7.8 Differences between MCU and H8/388R E6000 Emulator
- 7.9 Handling Evaluation Chip Board (HS388REBK61H)
- 7.10 Host PC Interface (only for HS38000EPI61H + HS388REBK61H)
- Section 8 Software Specifications Specific to This Product
- 8.1 Software Specifications of the H8/3800 E6000 Emulator
- 8.1.1 Target Hardware
- 8.1.2 Selectable Platform
- 8.1.3 [Configuration Properties] Dialog Box ([General] Page)
- 8.1.4 Memory Mapping Function
- 8.1.5 [Status] Window
- 8.1.6 Extended Monitor Function
- 8.1.7 Signals to Indicate Bus States and Areas
- 8.1.8 Monitoring Function
- 8.1.9 Trigger Points
- 8.1.10 Trace Information
- 8.1.11 Searching for a Trace Record
- 8.1.12 Trace Filtering Function
- 8.2 Note on Usage of the H8/3800 E6000 Emulator
- 8.3 Software Specifications of the H8/388R E6000 Emulator
- 8.3.1 Target Hardware
- 8.3.2 Selectable Platforms
- 8.3.3 [Configuration Properties] Dialog Box ([General] Page)
- 8.3.4 Memory Mapping Function
- 8.3.5 [Status] Window
- 8.3.6 Extended Monitor Function
- 8.3.7 Signals to Indicate Bus States and Areas
- 8.3.8 Monitoring Function
- 8.3.9 Trigger Points
- 8.3.10 Trace Information
- 8.3.11 Searching for a Trace Record
- 8.3.12 Trace Filtering Function
- 8.4 Note on Usage of the H8/388R E6000 Emulator
- 8.5 Performance Analysis Function
- 8.1 Software Specifications of the H8/3800 E6000 Emulator
- Appendix A I/O File Format
- Appendix B Menus
- Appendix C Command Lines
- Appendix D Diagnostic Test Procedure
- Colophon

204
8.3.5 [Status] Window
Selecting [View -> CPU -> Status] or clicking the [Status Display] toolbar button displays the [Status] window.
The [Status] window has three sheets. This emulator displays the following items.
(1) [Memory] Sheet
Selecting the [Memory] tab on the [Status] window displays this sheet.
Table 8.17 [Memory] Sheet Items
[Item] Column [Status] Column
Target Device Configuration Displays memory mapping.
System Memory Resources Displays the memory resource of the emulator hardware.
Program Name Displays the program file name.
(2) [Platform] Sheet
Selecting the [Platform] tab on the [Status] window displays this sheet.
Table 8.18 [Platform] Sheet Items
[Item] Column [Status] Column
Connected To: Displays emulator name (driver used).
CPU Displays the target MCU name.
Mode Displays the selected mode.
Clock source Displays the selected clock.
Subclock source Displays the selected sub-clock.
Run status Displays the execution status.
Break: The user program breaks
Running: The user program is running
Cause of last break Displays the cause of the emulator stopped at a break. If a program
breaks in the sub-active state, '(SubActive)' will be displayed after the
cause of the break.
Ready: User program not executed (immediately after starting the High-
performance Embedded Workshop)
User Break: Break by the user
Software Break: Break by software breakpoint
On Chip Break B: Break by On Chip Break
Complex Event System: Break by complex event system
Stepping Completed: Break by stepping completed
Stepping Aborted: Break by stepping aborted
ROM Write Access Break: Break by writing to ROM
Write-protect Access Break: Break by writing to a read-only memory
Unused Area Access Break: Break by accessing to a guarded memory
Stack In I/O Area: Break by a stack in the I/O area
Invalid breakpoint: Break by a break instruction without Software Break
Event Time Count Displays the measured result of the timer between events.
Run Time Count Displays the total execution time of the program.