
Operator's Manual
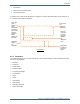
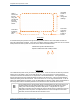
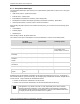
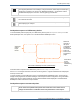
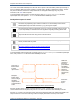
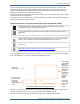
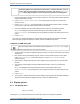
Table Of Contents

8.3 Trends
Tempus Pro User/Operator Manual - 41-2001EN-00 – Page 157
Interventions
GCS events, but not body maps
Laryngoscope image
A maximum of 4 events can be displayed on the graph in a 4-minute interval and there can be a delay of up
to 1 minute before events are displayed.
8.3.2 Trend table
The Trend Table allows you to scroll through all the 1-minute sample readings. When enabled the following
events are also displayed:
Waveform
Arrhythmia
Patient Alarm
Camera Images
Laryngoscope Images
12-Lead ECG
Drugs
Fluids
Assessments
Interventions
Body Maps and GCS
Ultrasound Images
Trend Graph
Left / right
scroll
buttons
move
backwards /
forwards in
time. Press
up down
arrows to
adjust
position of
the vitals
Event icons
are
displayed
in this area
Select the
vitals to
be
displayed
Press an
event icon
to cause
the event
details to
be
displayed
here
Press here
to centre or
zoom the
graph