
Operator's Manual
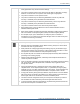
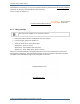
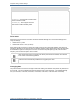
Table Of Contents

6.3 Pulse oximetry
Tempus Pro User/Operator Manual - 41-2001EN-00 – Page 95
6.3.1 Getting started
To use the pulse oximeter, remove the soft finger probe from the back of the device. Attach it to a well-
perfused finger of the patient taking care to ensure it is not the same arm which has a blood pressure cuff
attached. The readings will begin a few seconds after the probe is attached to the patient.
The SpO
2
section gives the oxygen saturation of the blood and shows the plethysmogram, signal strength
(in bar graph form) and the perfusion index.
The Signal Quality bar graph shows how well the pulse sensor is detecting the pulse. The amplitude of the
indication indicates the quality of detection. If the indication on the Signal Strength meter is low, or becomes
low, then the finger sensor should be repositioned. Similarly, the Perfusion Index gives a numerical
indication of the level of arterial pulsatile blood at the sensor site.
The Pulse Rate displayed on the Tempus Pulse Oximeter may differ slightly from the heart rate displayed on
ECG monitors due to differences in averaging times. There may also be a discrepancy between cardiac
electrical activity and peripheral arterial pulsation. Significant differences may indicate a problem with the
signal quality due to physiological changes in the patient or one of the instruments or application of the
sensor or patient cable. The pulsations from intra-aortic balloon support can cause the pulse rate displayed
on the Tempus to be significantly different than the ECG heart rate.
The perfusion index (PI) indicator provides a relative numeric indication of the pulse strength at the
monitoring site. It is a calculated percentage between the pulsatile signal and non-pulsatile signal of arterial
blood moving through the site. PI may be used to find the best perfused site and to monitor physiological
changes in the patient. It displays an operating range of 0.02 % to 20.00 %. A percentage greater than 1.00
% is desired. Extreme changes in the display number are due to motion artefact and changes in physiology
and blood flow.
The device indicates perfusion on a 7-bar LED indicator. The lower two segments of the bar will turn red
when the amplitude of the arterial pulsations is very low (low perfusion). It has been suggested that at
extremely low perfusion levels, pulse oximeters can measure peripheral saturation, which may differ from
central arterial saturation. This “localized hypoxemia” may result from the metabolic demands of other
tissues extracting oxygen proximal to the monitoring site under conditions of sustained peripheral
hypoperfusion. (This may occur even with a pulse rate that correlates with the ECG heart rate.)
CAUTION
If the low perfusion indication is frequently displayed, find a better-perfused monitoring site.
In the interim assess the patient and if indicated verify oxygenation status through other
means.
6.3.2 Pleth variability index
Pleth Variability Index or PVI
®
helps users to discern between patients who may respond to fluid from those
who may not.
PVI has been shown to help clinician to predict fluid responsiveness in mechanically ventilated patients
under general anaesthesia, defined as a significant increase in cardiac output after fluid administration. PVI
is an automatic measure of the dynamic change in Perfusion Index (PI) that occurs during the respiratory
cycle.
PVI = ((PI
max
-PI
min
)/PI
max
) x 100.
The greater the PVI, the more likely the patient will respond to fluid administration. Typically, a PVI of >14%
prior to volume expansion is predictive that a mechanically ventilated patient will respond to fluid
The Pulse Oximetry Section of the Home Screen
The SpO
2
reading is
provided shown
here
The
plethysmogram is
shown
continuously
The signal
strength and
perfusion index
of the site are
shown here