
Installation guide


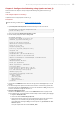

b. For Windows, the options need to be added to run.bat, as it does not read
run.conf.
c. Check boot.log to see the value of the user.dir environment variable (e.g.
<JBOSS_HOME>/bin), the default location for garbage collection logging when no
path is provided. If you are running multiple instances of JBoss against the same
directory like so:
./run.sh -c node1 -b 127.0.0.1 -Djboss.messaging.ServerPeerID=1
./run.sh -c node2 -b 127.0.0.1 -Djboss.messaging.ServerPeerID=2
-Djboss.service.binding.set=ports-01
d. T hen for the gc.log files to be properly separated you will need to make sure
each <PROFILE> has a unique run.conf with the JVM_OPTS specific to that
<PROFILE>.
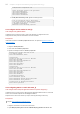
For example node1 will contain a <JBOSS_HOME>/server/node1/run.conf with
contents:
JAVA_OPTS="$JAVA_OPTS -verbose:gc -Xloggc:gc_node1.log -
XX:+PrintGCDetails -XX:+PrintGCDateStamps"
e. And <JBOSS_HOME>/server/node2/run.conf with contents:
JAVA_OPTS="$JAVA_OPTS -verbose:gc -Xloggc:gc_node2.log -
XX:+PrintGCDetails -XX:+PrintGCDateStamps"
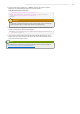
Important
gc.log is recreat ed e very t ime JBoss sta rts.
e sure to back up gc.log if you are restarting the server. Alternatively you
may be able to add a timestamp to the file name depending on the OS
and/or shell. For example, with OpenJDK or Oracle/Sun JDK on Linux: -
Xloggc:gc.log.`date +%Y%m%d%H%M%S`.
f. On Windows, you can use
for /f "tokens=2-4 delims=/ " %%a in ('date /t') do (set
mydate=%%c-%%a-%%b)
for /f "tokens=1-2 delims=/:" %%a in ("%TIME%") do (set
mytime=%%a%%b)
set "JAVA_OPTS=%JAVA_OPTS% -
Xloggc:C:/log/gv.log.%mydate%_%mytime%
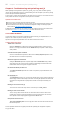
2. For the time period when there are slowdowns, hangs, or errors, gather the following
data:
Garbage collection logs. Follow Procedure 4.5, “JBoss/JVM Problems”.
High CPU data coupled with thread dumps (depending upon platform):
The links below can assist in gathering Java thread data. A Red Hat subscription is
required.
CPU utilization by Java threads on Linux/Solaris:
https://access.redhat.com/knowledge/node/46596.
CPU utilization by Java threads on Windows:
https://access.redhat.com/knowledge/node/46598.
For cases where the Java application is an application server, gather log files:
In JBoss:
<JBOSS_HOME>/server/<PROFILE>/log/server.log
<JBOSS_HOME>/server/<PROFILE>/log/boot.log
In T omcat:
catalina.out
3. Determine if the CPU utilization is caused by the JVM (Java application). Here, you want
to validate that a Java process is indeed using an unexpected amount of CPU.
The Java thread data gathered in the first step should help identify this.
4. Assuming a Java process is identified as the cause of high CPU, the most common
cause is java Garbage collection. Determine if the high CPU is caused by Java garbage
collection by analyzing the garbage collection for long pause times and/or low throughput
overall at the time of the issue.
To find the garbage collection logging related to the issue, it is necessary to determine
the number of seconds after JVM startup that the issue happens (that is the typical
format of garbage collection logging timestamps). T o determine the time elapsed, you can
use the first timestamp in the high CPU data gathered and the first timestamp in the
console log, boot.log (JBoss), server.log (JBoss), or catalina.out (T omcat.)
If you see long pause times and/or low throughput overall, refer to the following
Knowledge Base article (Red Hat subscription required)
JBoss Enterprise Application Platform 5 HTTP Connectors Load Balancing Guide 19