
User guide


Chapter 6. Profiling
76
The perf tool can also record samples. For example, to record data on the make command and its
children, use:
perf record -- make all
This will print out the file in which the samples are stored, along with the number of samples collected:
[ perf record: Woken up 42 times to write data ]
[ perf record: Captured and wrote 9.753 MB perf.data (~426109 samples) ]
You can then analyze perf.data to determine the relative frequency of samples. The report output
includes the command, object, and function for the samples. Use perf report to output an analysis
of perf.data. For example, the following command produces a report of the executable that
consumes the most time:
perf report --sort=comm
The resulting output:
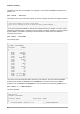
# Samples: 1083783860000
#
# Overhead Command
# ........ ...............
#
48.19% xsltproc
44.48% pdfxmltex
6.01% make
0.95% perl
0.17% kernel-doc
0.05% xmllint
0.05% cc1
0.03% cp
0.01% xmlto
0.01% sh
0.01% docproc
0.01% ld
0.01% gcc
0.00% rm
0.00% sed
0.00% git-diff-files
0.00% bash
0.00% git-diff-index
The column on the left shows the relative frequency of the samples. This output shows that make
spends most of this time in xsltproc and the pdfxmltex. To reduce the time for the make to
complete, focus on xsltproc and pdfxmltex. To list of the functions executed by xsltproc, run:
perf report -n --comm=xsltproc
This would generate:
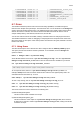
comm: xsltproc
# Samples: 472520675377
#
# Overhead Samples Shared Object Symbol
# ........ .......... ............................. ......
#
45.54%215179861044 libxml2.so.2.7.6 [.] xmlXPathCmpNodesExt