
User guide


Perf Tool Commands
75
switches. For example, PCL counters can compute the Instructions Per Clock (IPC) from a process's
counts of instructions retired and processor clock cycles. A low IPC ratio indicates the code makes
poor use of the CPU. Other hardware events can also be used to diagnose poor CPU performance.
Performance counters can also be configured to record samples. The relative frequency of samples
can be used to identify which regions of code have the greatest impact on performance.
6.6.1. Perf Tool Commands
Useful perf commands include the following:
perf stat
This perf command provides overall statistics for common performance events, including
instructions executed and clock cycles consumed. Options allow selection of events other than the
default measurement events.
perf record
This perf command records performance data into a file which can be later analyzed using perf
report.
perf report
This perf command reads the performance data from a file and analyzes the recorded data.
perf list
This perf command lists the events available on a particular machine. These events will vary
based on the performance monitoring hardware and the software configuration of the system.
Use perf help to obtain a complete list of perf commands. To retrieve man page information on
each perf command, use perf help command.
6.6.2. Using Perf
Using the basic PCL infrastructure for collecting statistics or samples of program execution is relatively
straightforward. This section provides simple examples of overall statistics and sampling.
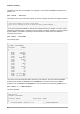
To collect statistics on make and its children, use the following command:
perf stat -- make all
The perf command will collect a number of different hardware and software counters. It will then print
the following information:
Performance counter stats for 'make all':
244011.782059 task-clock-msecs # 0.925 CPUs
53328 context-switches # 0.000 M/sec
515 CPU-migrations # 0.000 M/sec
1843121 page-faults # 0.008 M/sec
789702529782 cycles # 3236.330 M/sec
1050912611378 instructions # 1.331 IPC
275538938708 branches # 1129.203 M/sec
2888756216 branch-misses # 1.048 %
4343060367 cache-references # 17.799 M/sec
428257037 cache-misses # 1.755 M/sec
263.779192511 seconds time elapsed