
User guide


Chapter 6. Profiling
74
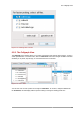
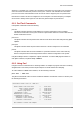
Figure 6.10. Aggregate View
The Aggregate View depicts all functions as boxes; the size of each box represents a function's
execution time relative to the total running time of the program. Darker-colored boxes represent
functions that are called more times relative to others; for example, in Figure 6.10, “Aggregate View”,
the CallThisThirtyTimes function is called the most number of times (150).
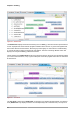
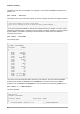
Figure 6.11. Collapse Mode
The Callgraph view's toolbar also features a Collapse Mode button. This groups all identical
functions (i.e. those with identical names and call histories) together into one node. Doing so can be
helpful in reducing screen clutter for programs where many functions get called multiple times.
Go to Code
To navigate to a function in the code from any view, press Ctrl while double-clicking on its node.
Doing so will open the corresponding source file in the Eclipse editor and highlight the function's
declaration in the source.
6.6. Performance Counters for Linux (PCL) Tools and perf
Performance Counters for Linux (PCL) is a new kernel-based subsystem that provides a framework
for collecting and analyzing performance data. These events will vary based on the performance
monitoring hardware and the software configuration of the system. Red Hat Enterprise Linux 6
includes this kernel subsystem to collect data and the user-space tool perf to analyze the collected
performance data.
The PCL subsystem can be used to measure hardware events, including retired instructions and
processor clock cycles. It can also measure software events, including major page faults and context