
User guide


Using OProfile
65
oparchive
The oparchive command generates a directory populated with executable, debug, and OProfile
sample files. This directory can be moved to another machine (via tar), where it can be analyzed
offline.
opgprof
Like opreport, the opgprof command outputs profile data for a given binary image from an
OProfile session. The output of opgprof is in gprof format.
For a complete list of OProfile commands, refer to man oprofile. For detailed information on
each OProfile command, refer to its corresponding man page. Refer to Section 6.3.4, “OProfile
Documentation” for other available documentation on OProfile.
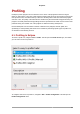
6.3.2. Using OProfile
The oprofile package and its dependencies install all the necessary utilities for performing an
OProfile profile run. To instruct the OProfile to profile all the application running on the system and
to group the samples for the shared libraries with the application using the library, run the following
command as root:
opcontrol --no-vmlinux --separate=library --start
You can also start the OProfile daemon without collecting system data. To do so, use the option --
start-daemon instead. The --stop option halts data collection, while the --shutdown terminates
the OProfile daemon.
Use opreport, opannotate, or opgprof to display the collected profiling data. By default, the data
collected by the OProfile daemon is stored in /var/lib/oprofile/samples/.
6.3.3. OProfile Plug-in For Eclipse
The OProfile suite of tools provide powerful call profiling capabilities; as a plug-in, these capabilities
are well ported into the Eclipse user interface. The OProfile Plug-in provides the following benefits:
Targeted Profiling
The OProfile Plug-in will allow Eclipse users to profile a specific binary, include related shared
libraries/kernel modules, and even exclude binaries. This produces very targeted, detailed usage
results on each binary, function, and symbol, down to individual line numbers in the source code.
User Interface Fully Integrated into CDT
The plug-in displays enriched OProfile results through Eclipse, just like any other plug-in. Double-
clicking on a source line in the results brings users directly to the corresponding line in the Eclipse
editor. This allows users to build, profile, and edit code through a single interface, making profiling
a convenient experience for Eclipse users. In addition, profile runs are launched and configured the
same way as C/C++ applications within Eclipse.
Fully Customizable Profiling Options
The Eclipse interface allows users to configure their profile run using all options available in the
OProfile command-line utility. The plug-in supports event configuration based on processor debugging
registers (i.e. counters), as well as interrupt-based profiling for kernels or processors that don't support
hardware counters.