
User guide

Chapter 6. Profiling
64
• Memcheck
• Massif
• Cachegrind
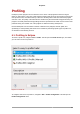
The Valgrind plug-in for Eclipse is provided by the eclipse-valgrind package. For more
information about this plug-in, refer to Valgrind Integration User Guide in the Eclipse Help Contents.
6.2.4. Valgrind Documentation
For more extensive information on Valgrind, refer to man valgrind. Red Hat Enterprise Linux 6 also
provides a comprehensive Valgrind Documentation book, available as PDF and HTML in:
• file:///usr/share/doc/valgrind-version/valgrind_manual.pdf
• file:///usr/share/doc/valgrind-version/html/index.html
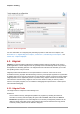
The Valgrind Integration User Guide in the Eclipse Help Contents also also provides detailed
information on the setup and usage of the Valgrind plug-in for Eclipse. This guide is provided by the
eclipse-valgrind package.
6.3. OProfile
OProfile is a system-wide Linux profiler, capable of running at low overhead. It consists of a kernel
driver and a daemon for collecting raw sample data, along with a suite of tools for parsing that data
into meaningful information. OProfile is generally used by developers to determine which sections of
code consume the most amount of CPU time, and why.
During a profile run, OProfile uses the processor's performance monitoring hardware. Valgrind rewrites
the binary of an application, and in turn instruments it. OProfile, on the other hand,simply profiles a
running application as-is. It sets up the performance monitoring hardware to take a sample every x
number of events (e.g. cache misses or branch instructions). Each sample also contains information
on where it occurred in the program.
OProfile's profiling methods consume less resources than Valgrind. However, OProfile requires root
privileges. OProfile is useful for finding "hot-spots" in code, and looking for their causes (e.g. poor
cache performance, branch mispredictions).
Using OProfile involves starting the OProfile daemon (oprofiled), running the program to be
profiled, collecting the system profile data, and parsing it into a more understandable format. OProfile
provides several tools for every step of this process.
6.3.1. OProfile Tools
The most useful OProfile commands include the following:
opcontrol
This tool is used to start/stop the OProfile daemon and configure a profile session.
opreport
The opreport command outputs binary image summaries, or per-symbol data, from OProfile
profiling sessions.
opannotate
The opannotate command outputs annotated source and/or assembly from the profile data of an
OProfile session.