
User guide

Using Valgrind
63
cachegrind
Cachegrind is a cache profiler that accurately pinpoints sources of cache misses in code by
performing a detailed simulation of the I1, D1 and L2 caches in the CPU. It shows the number
of cache misses, memory references, and instructions accruing to each line of source code;
Cachegrind also provides per-function, per-module, and whole-program summaries, and can
even show counts for each individual machine instructions.
callgrind
Like cachegrind, callgrind can model cache behavior. However, the main purpose of
callgrind is to record callgraphs data for the executed code.
massif
Massif is a heap profiler; it measures how much heap memory a program uses, providing
information on heap blocks, heap administration overheads, and stack sizes. Heap profilers
are useful in finding ways to reduce heap memory usage. On systems that use virtual memory,
programs with optimized heap memory usage are less likely to run out of memory, and may be
faster as they require less paging.
helgrind
In programs that use the POSIX pthreads threading primitives, Helgrind detects synchronisation
errors. Such errors are:
• Misuses of the POSIX pthreads API
• Potential deadlocks arising from lock ordering problems
• Data races (i.e. accessing memory without adequate locking)
Valgrind also allows you to develop your own profiling tools. In line with this, Valgrind includes the
lackey tool, which is a sample that can be used as a template for generating your own tools.
6.2.2. Using Valgrind
The valgrind package and its dependencies install all the necessary tools for performing a Valgrind
profile run. To profile a program with Valgrind, use:
valgrind --tool=toolname program
Refer to Section 6.2.1, “Valgrind Tools” for a list of arguments for toolname. In addition to the suite
of Valgrind tools, none is also a valid argument for toolname; this argument allows you to run a
program under Valgrind without performing any profiling. This is useful for debugging or benchmarking
Valgrind itself.
You can also instruct Valgrind to send all of its information to a specific file. To do so, use the option --
log-file=filename. For example, to check the memory usage of the executable file hello and
send profile information to output, use:
valgrind --tool=memcheck --log-file=output hello
Refer to Section 6.2.4, “Valgrind Documentation” for more information on Valgrind, along with other
available documentation on the Valgrind suite of tools.
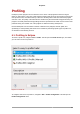
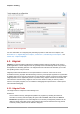
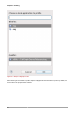
6.2.3. Valgrind Plug-in for Eclipse
The Valgrind plug-in for Eclipse (documented herein) integrates several Valgrind tools into Eclipse.
This allows Eclipse users to seamlessly include profiling capabilities into their workflow. At present, the
Valgrind plug-in for Eclipse supports three Valgrind tools: