
User guide

Chapter 6. Profiling
62
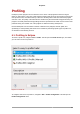
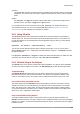
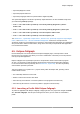
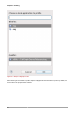
Figure 6.2. Profile Configuration
For more information on configuring and performing a profile run with each tool in Eclipse, refer
to Section 6.2.3, “Valgrind Plug-in for Eclipse ”, Section 6.3.3, “OProfile Plug-in For Eclipse ”, and
Section 6.5, “ Eclipse-Callgraph”.
6.2. Valgrind
Valgrind is an instrumentation framework for building dynamic analysis tools that can be used to
profile applications in detail. Valgrind tools are generally used to automatically detect many memory
management and threading problems. The Valgrind suite also includes tools that allow you to build
new profiling tools to suit your needs.
Valgrind provides instrumentation for user-space binaries to check for errors such as use of
uninitialized memory, improper allocation/freeing of memory, and improper arguments for systemcalls.
Its profiling tools can be used by normal users on most binaries; however, compared to other profilers,
Valgrind profile runs are significantly slower. To profile a binary, Valgrind rewrites its executable and
instruments the rewritten binary. Valgrind's tools are most useful for looking for memory-related
issues in user-space programs; it is not suitable for debugging time-specific issues or kernel-space
instrumentation/debugging.
6.2.1. Valgrind Tools
The Valgrind suite is composed of the following tools:
memcheck
This tool detects memory management problems in programs by checking all reads from
and writes to memory and intercepting all system calls to malloc, new, free, and delete.
Memcheck is perhaps the most used Valgrind tool, as memory management problems can be
difficult to detect using other means. Such problems often remain undetected for long periods,
eventually causing crashes that are difficult to diagnose.