
User guide

Chapter 6.
61
Profiling
Developers profile programs to focus attention on the areas of the program that have the largest
impact on performance. The types of data collected include what section of the program consumes the
most processor time, and where memory is allocated. Profiling collects data from the actual program
execution. Thus, the quality of the data collect is influenced by the actual tasks being performed by the
program. The tasks performed during profiling should be represenative of actual use; this ensures that
problems arising from realistic use of the program are addressed during development.
Red Hat Enterprise Linux 6 includes a number of different tools (Valgrind, OProfile, perf, and
SystemTap) to collect profiling data. Each tool is suitable for performing specific types of profile runs,
as described in the following sections.
6.1. Profiling In Eclipse
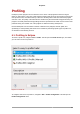
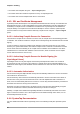
To launch a profile run, navigate to Run > Profile. This will open the Profile As dialogue, from which
you can select a tool for a profile run.
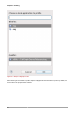
Figure 6.1. Profile As
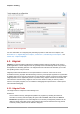
To configure each tool for a profile run, navigate to Run > Profile Configuration. This will open the
Profile Configuration menu.