Red Hat Enterprise Linux 6 Developer Guide An introduction to application development tools in Red Hat Enterprise Linux 6 Dave Brolley William Cohen Roland Grunberg Aldy Hernandez Karsten Hopp Jakub Jelinek
Developer Guide Jeff Johnston Benjamin Kosnik Aleksander Kurtakov Chris Moller Phil Muldoon Andrew Overholt Charley Wang Kent Sebastian
Red Hat Enterprise Linux 6 Developer Guide An introduction to application development tools in Red Hat Enterprise Linux 6 Edition 0 Author Author Author Author Author Author Author Author Author Author Author Author Author Author Editor Editor Dave Brolley William Cohen Roland Grunberg Aldy Hernandez Karsten Hopp Jakub Jelinek Jeff Johnston Benjamin Kosnik Aleksander Kurtakov Chris Moller Phil Muldoon Andrew Overholt Charley Wang Kent Sebastian Don Domingo Jacquelynn East brolley@redhat.com wcohen@redhat.
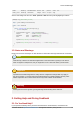
Developer Guide This document describes the different features and utilities that make Red Hat Enterprise Linux 6 an ideal enterprise platform for application development. It focuses on Eclipse as an end-to-end integrated development environment (IDE), but also includes command-line tools and other utilities outside Eclipse.
Preface vii 1. Document Conventions .................................................................................................. vii 1.1. Typographic Conventions .................................................................................... vii 1.2. Pull-quote Conventions ....................................................................................... viii 1.3. Notes and Warnings ............................................................................................ ix 2.
Developer Guide 5.2. GDB .......................................................................................................................... 5.2.1. Simple GDB .................................................................................................... 5.2.2. Running GDB .................................................................................................. 5.2.3. Conditional Breakpoints ................................................................................... 5.2.4.
Preface This book describes the some of the more commonly-used programming resources in Red Hat Enterprise Linux 6. Each phase of the application development process is described as a separate chapter, enumerating tools that accomplish different tasks for that particular phase. Note that this is not a comprehensive listing of all available development tools in Red Hat Enterprise Linux 6. In addition, each section herein does not contain detailed documentation of each tool.
Preface File-related classes include filesystem for file systems, file for files, and dir for directories. Each class has its own associated set of permissions. Proportional Bold This denotes words or phrases encountered on a system, including application names; dialog box text; labeled buttons; check-box and radio button labels; menu titles and sub-menu titles. For example: Choose System → Preferences → Mouse from the main menu bar to launch Mouse Preferences.
Notes and Warnings books books_tests Desktop Desktop1 documentation downloads drafts images mss notes photos scripts stuff svgs svn Source-code listings are also set in mono-spaced roman but add syntax highlighting as follows: package org.jboss.book.jca.ex1; import javax.naming.InitialContext; public class ExClient { public static void main(String args[]) throws Exception { InitialContext iniCtx = new InitialContext(); Object ref = iniCtx.
Preface • search or browse through a knowledgebase of technical support articles about Red Hat products. • submit a support case to Red Hat Global Support Services (GSS). • access other product documentation. Red Hat also hosts a large number of electronic mailing lists for discussion of Red Hat software and technology. You can find a list of publicly available mailing lists at https://www.redhat.com/mailman/ listinfo.
Chapter 1. Introduction to Eclipse Eclipse is a powerful development environment that provides tools for each phase of the development process. It is integrated into a single, fully configurable user interface for ease of use, featuring a pluggable architecture which allows for extension in a variety of ways. Eclipse integrates a variety of disparate tools into a unified environment to create a rich development experience.
Chapter 1. Introduction to Eclipse A project can be imported directly into Eclipse if it contains the necessary Eclipse metafiles. Eclipse uses these files to determine what kind of perspectives, tools, and other user interface configurations to implement. As such, when attempting to import a project that has never been used on Eclipse, it may be necessary to do so through the New Project wizard instead of the Import wizard.
Help In Eclipse Figure 1.3. Import Wizard 1.2. Help In Eclipse Eclipse features a comprehensive internal help library that covers nearly every facet of the Integrated Development Environment (IDE). Every Eclipse documentation plug-in installs its content to this library, where it is indexed accordingly. To access this library, use the Help menu.
Chapter 1. Introduction to Eclipse Figure 1.4. Help To open the main Help menu, navigate to Help > Help Contents. The Help menu displays all the available content provided by installed documentation plug-ins in the Contents field. Figure 1.5.
Development Toolkits The tabs at the bottom of the Contents field provides different options for accessing Eclipse documentation. You can navigate through each "book" by section/header or by simply searching via the Search field. You can also bookmark sections in each book and access them through the Bookmarks tab. The Workbench User Guide documents all facets of the Eclipse user interface extensively.
Chapter 1. Introduction to Eclipse editor, for example, provides error parsing in the context of a single file, but some errors may only be visible when a complete project is built. Other common features among toolkit-supplied editors are colorization, code folding, and automatic indentation.
Chapter 2. The Eclipse Integrated Development Environment (IDE) The entire user interface in Figure 2.1, “Eclipse User Interface (default)” is referred to as the Eclipse workbench. It is generally composed of a code Editor, Project Explorer window, and several views. All elements in the Eclipse workbench are configurable, and fully documented in the Workbench User Guide (Help Contents). Refer to Section 2.2, “Useful Hints” for a brief overview on customizing the user interface.
Chapter 2. The Eclipse Integrated Development Environment (IDE) Figure 2.1, “Eclipse User Interface (default)” displays the default workbench for C/C++ projects. To switch between available perspectives in a workbench, press Ctrl+F8. For some hints on perspective customization, refer to Section 2.2, “Useful Hints”. The figures that follow describe each basic element visible in the default C/C++ perspective. Figure 2.2. Eclipse Editor The Editor is used to write and edit source files.
User Interface The View Menu button in the Project Explorer View allows you to configure whether projects or working sets are the top-level items in the Project Explorer View. A working set is a group of projects arbitrarily classified as a single set; working sets are handy in organizing related or linked projects. Figure 2.4. Outline Window The Outline window provides a condensed view of the code in a source file.
Chapter 2. The Eclipse Integrated Development Environment (IDE) The Tasks view allows you to track specially-marked reminder comments in the code. This view shows the location of each task comment and allows you to sort them in several ways. Figure 2.7. Sample of Tracked Comment Most Eclipse editors track comments marked with //FIXME or //TODO tags. Tracked comments —i.e. task tags—are different for source files written in other languages.
Useful Hints Alternatively, you can also use Edit > Add Task to open the task Properties menu (Figure 2.8, “Task Properties”). This will allow you to add a task to a specific location in a source file without using a task tag. Figure 2.9. Problems View The Problems view displays any errors or warnings that occurred during the execution of specific actions such as builds, cleans, or profile runs. To display a suggested "quick fix" to a specific problem, select it and press Ctrl+1. 2.2.
Chapter 2. The Eclipse Integrated Development Environment (IDE) Figure 2.10. Quick Access Menu In Figure 2.10, “Quick Access Menu”, clicking Views > Project Explorer will select the Project Explorer window. Clicking any item from the Commands, Menus, New, or Preferences categories to run the selected item. This is similar to navigating to or clicking the respective menu options or taskbar icons. You can also navigate through the quick access menu using the arrow keys.
The quick access menu Figure 2.11. Keyboard Shortcuts To configure Eclipse keyboard shortcuts, press Shift+Ctrl+L again while the Keyboard Shortcuts list is open. Figure 2.12.
Chapter 2. The Eclipse Integrated Development Environment (IDE) To customize the current perspective, navigate to Window > Customize Perspective. This will opens the Customize Perspective menu, allowing the visible tool bars, main menu itmes, command groups, and short cuts to be configured. The location of each view within the workbench can be customized by clicking on a view's title and dragging it to a desired location. Figure 2.13. Customize Perspective Menu Figure 2.
The quick access menu Figure 2.15. Menu Visibility Tab The Menu Visibility tab configures what functions are visible in each main menu item. For a brief overview of each main menu item, refer to Reference > C/C++ Menubar in the C/C++ Development User Guide or Reference > Menus and Actions in the Java Development User Guide.
Chapter 2. The Eclipse Integrated Development Environment (IDE) Figure 2.16. Command Group Availability Tab Command groups add functions or options to the main menu or tool bar area. Use the Command Group Availability tab to add or remove a Command group. The Menubar details and Toolbar details fields display the functions or options added by the Command group to either Main Menu or Toolbar Area, respectively.
libhover Plug-in Figure 2.17. Shortcuts Tab The Shortcuts tab configures what menu items are available under the following submenus: • File > New • Window > Open Perspective • Window > Show View 2.2.2. libhover Plug-in The libhover plug-in for Eclipse provides plug-and-play hover help support for the GNU C Library and GNU C++ Standard Library.
Chapter 2. The Eclipse Integrated Development Environment (IDE) In addition, C++ also has type definitions and templated classes to deal with. Such information requires parsing an entire file and its associated include files; libhover can only do this via indexing. C functions, on the other hand, can be referenced in their documentation by name alone. As such, libhover does not need to index C source files in order to provide hover help or code completion.
libhover Plug-in Figure 2.19. Using Hover Help To use code completion, select a string in the code and press Ctrl+Space. This will display all possible functions given the selected string; click on a possible function to view its description. Figure 2.20.
20
Chapter 3. Libraries and Runtime Support Red Hat Enterprise Linux 6 supports the development of custom applications in a wide variety of programming languages using proven, industrial-strength tools. This chapter describes the runtime support libraries provided in Red Hat Enterprise Linux 6. 3.1. Version Information The following table compares the version information for runtime support packages in supported programming languages between Red Hat Enterprise Linux 6 and Red Hat Enterprise Linux 5.
Chapter 3. Libraries and Runtime Support This type of compatibility is defined by conformance with specified Application Binary Interfaces (ABIs). 3.2.1. API Compatibility Source compatibility enables a body of application source code to be compiled and operate correctly on multiple instances of an operating environment, across one or more hardware architectures, as long as the source code is compiled individually for each specific hardware architecture.
Static Linking compliant to the latest revision of the language standards available in more recent Red Hat Enterprise Linux releases. As such, Red Hat advises that you refer to the Red Hat Enterprise Linux 6 Application Compatibility 4 Specification for guidance. This document outlines Red Hat policy and recommendations regarding backwards compatibility, particularly for specific packages. 3.2.4. Static Linking Static linking is emphatically discouraged for all Red Hat Enterprise Linux releases.
Chapter 3.
The GNU C Library • sched_getcpu • accept4 • fallocate • fallocate64 • inotify_init1 • dup3 • epoll_create1 • pipe2 • signalfd • eventfd • eventfd_read • eventfd_write • Added new checking functions, namely: • asprintf • dprintf • obstack_printf • vasprintf • vdprintf • obstack_vprintf • fread • fread_unlocked • open* • mq_open For a more detailed list of updates to the GNU C Library, refer to /usr/share/doc/ glibc-version/NEWS . All changes as of version 2.
Chapter 3. Libraries and Runtime Support 3.3.2. The GNU C++ Standard Library The libstdc++ package contains the GNU C++ Standard Library, which is an ongoing project to implement the ISO 14882 Standard C++ library. Installing the libstdc++ package will provide just enough to satisfy link dependencies (i.e. only shared library files). To make full use of all available libraries and header files for C++ development, you must install libstdc++-devel as well.
The GNU C++ Standard Library • • • • • • • • • Added support for the -fvisibility command. • Added the following extensions: • __gnu_cxx::typelist • __gnu_cxx::throw_allocator For more information about updates to libstdc++ in Red Hat Enterprise Linux 6, refer to the C++ Runtime Library section of the following documents: • GCC 4.2 Release Series Changes, New Features, and Fixes: http://gcc.gnu.
Chapter 3. Libraries and Runtime Support SYNOPSIS Inherits std::_Vector_base< _Tp, _Alloc >.
Boost • boost-test • boost-thread • boost-wave Not included in the meta-package are packages for static linking or packages that depend on the underlying Message Passing Interface (MPI) support. 10 MPI support is provided in two forms: one for the default Open MPI implementation , and another for the alternate MPICH2 implementation. The selection of the underlying MPI library in use is up to the user and depends on specific hardware details and user preferences.
Chapter 3. Libraries and Runtime Support • Statechart • TR1 • Typeof • Xpressive • Asio • Bitmap • Circular Buffer • Function Types • Fusion • GIL • Interprocess • Intrusive • Math/Special Functions • Math/Statistical Distributions • MPI • System • Accumulators • Exception • Units • Unordered • Proto • Flyweight • Scope Exit • Swap • Signals2 • Property Tree Many of the existing libraries have been improved, bug-fixed, and otherwise enhanced. 3.3.3.2.
Qt 11 The main site for the development of Boost is hosted on boost.org . 3.3.4. Qt The qt package provides the Qt (pronounced "cute") cross-platform application development framework used in the development of GUI programs. Aside from being a popular "widget toolkit", Qt is also used for developing non-GUI programs such as console tools and servers. Qt was used in the development of notable projects such as Google Earth, KDE, Opera, OPIE, VoxOx, Skype, VLC media player and VirtualBox.
Chapter 3. Libraries and Runtime Support • http://doc.qt.nokia.com/4.6/qt4-intro.html 3.3.4.2. Qt Creator Qt Creator is a cross-platform IDE tailored to the needs of Qt developers. It includes the following graphical tools: • An advanced C++ code editor • Integrated GUI layout and forms designer • Project and build management tools • Integrated, context-sensitive help system • Visual debugger • Rapid code navigation tools For more information about Qt Creator, refer to the following link: http://qt.nokia.
KDE Development Framework Sonnet Sonnet is a multilingual spell-checking application that supports automatic language detection, primary/backup dictionaries, and other useful features. It replaces kspell2 in KDE4. KIO The KIO library provides a framework for network-transparent file handling, allowing users to easily access files through network-transparent protocols. It also helps provides standard file dialogs.
Chapter 3. Libraries and Runtime Support KNewStuff2 KNewStuff2 is a collaborative data sharing library used by many KDE4 applications. For more information, refer to http://techbase.kde.org/Projects/KNS2. 3.3.5.2. kdelibs Documentation The kdelibs-apidocs package provides HTML documentation for the KDE development framework in /usr/share/doc/HTML/en/kdelibs4-apidocs/. The following links also provide details on KDE-related programming tasks: • http://techbase.kde.org/ • http://techbase.kde.
Java Help on module math: NAME math FILE /usr/lib64/python2.6/lib-dynload/mathmodule.so DESCRIPTION This module is always available. It provides access to the mathematical functions defined by the C standard. FUNCTIONS acos[...] acos(x) Return the arc cosine (measured in radians) of x. acosh[...] acosh(x) Return the hyperbolic arc cosine (measured in radians) of x. asin(...) asin(x) Return the arc sine (measured in radians) of x. asinh[...
Chapter 3. Libraries and Runtime Support 3.3.8. Ruby The ruby package provides the Ruby interpreter and adds support for the Ruby programming language. The ruby-devel package contains the libraries and header files needed for developing Ruby extensions. Red Hat Enterprise Linux also ships with numerous ruby-related packages. By convention, the names of these packages have a ruby or rubygem prefix or suffix. Such packages are either library extensions or Ruby bindings to an existing library.
Perl The main site for the development of Ruby is hosted on http://www.ruby-lang.org. The http://www.rubydoc.org site also contains Ruby documentation. 3.3.9. Perl The perl package adds support for the Perl programming language. This package provides Perl core modules, the Perl Language Interpreter, and the PerlDoc tool. Red Hat also provides various perl modules in package form; these packages are named with the perl-* prefix.
Chapter 3. Libraries and Runtime Support 3.3.9.3. Perl Documentation The perldoc tool provides documentation on language and core modules. To learn more about a module, use perldoc module_name. For example, perldoc CGI will display the following information about the CGI core module: NAME CGI - Handle Common Gateway Interface requests and responses SYNOPSIS use CGI; my $q = CGI->new; [...] DESCRIPTION CGI.
Chapter 4. Compiling and Building Red Hat Enterprise Linux 6 includes many packages used for software development, inluding tools for compiling and building source code. This chapter discusses several of these packages and tools used to compile source code. 4.1. GNU Compiler Collection (GCC) The GNU Compiler Collection (GCC) is a set of tools for compiling a variety of programming languages (including C, C++, ObjectiveC,ObjectiveC++, Fortran, and Ada) into highly optimized machine code.
Chapter 4. Compiling and Building • Updates in the 4.2 Series: http://gcc.gnu.org/gcc-4.2/changes.html • Updates in the 4.3 Series: http://gcc.gnu.org/gcc-4.3/changes.html • Updates in the 4.4 Series: http://gcc.gnu.org/gcc-4.4/changes.html In addition to the changes introduced via the GCC 4.4 rebase, the Red Hat Enterprise Linux 6 version of GCC also features several fixes and enhancements backported from upstream sources (i.e. version 4.5 and beyond).
Language Compatibility The default system C++ compiler included with Red Hat Enterprise Linux 6 conforms to the C++ ABI 4 defined by the Itanium C++ ABI (1.86) . Although every effort has been made to keep each version of GCC compatibile with previous releases, some incompatibilities do exist. ABI incompatibilities between RHEL6 and RHEL5 The following is a list of known incompatibilities between the Red Hat Enterprise Linux 6 and 5 toolchains.
Chapter 4. Compiling and Building The C ABI is considered to be stable, and has been so since at least RHEL3 (again, barring any incompatibilities mentioned in the above lists). Libraries built on RHEL3 and later can be linked to objects created on a subsequent environment (RHEL4, RHEL5, and RHEL6). The C++ ABI is considered to be stable, but less stable than the C ABI, and only as of RHEL4 (corresponding to GCC version 3.4 and above.). As with C, this is only an upward compatibility.
Backwards Compatibility Packages Object file changes, such as the ones listed above, may interfere with the portable use of prelink. 4.1.4. Backwards Compatibility Packages Several packages are provided to serve as an aid for those moving source code or executables from older versions of Red Hat Enterprise Linux to the current release.
Chapter 4. Compiling and Building In brief, the tools work via the gcc command. This is the main driver for the compiler. It can be used from the command line to pre-process or compile a source file, link object files and libraries, or perform a combination thereof. By default, gcc takes care of the details and links in the provided libgcc library. The compiler functions provided by GCC are also integrated into the Eclipse IDE as part of the CDT.
Running GCC } The following procedure illustrates the compilation process for C++ in its most basic form. Procedure 4.2. Compiling a 'Hello World' C++ Program 1. Compile hello.cc into an executable with: g++ hello.cc -o hello Ensure that the resulting binary hello is in the same directory as hello.cc. 2. Run the hello binary, i.e. hello. 4.1.6.3. Simple Multi-File Usage To use basic compilation involving multiple files or object files, start with the following two source files: one.c #include
Chapter 4. Compiling and Building 4.1.6.4. Recommended Optimization Options Different projects require different optimization options. There is no one-size-fits-all approach when it comes to optimization, but here are a few guidelines to keep in mind. Instruction selection and tuning It is very important to chose the correct architecture for instruction scheduling.
Running GCC String [ [ [ [ [ dump 0] 8] 17] 1b] 21] of section '.GCC.command.line': hello.c -mtune=generic -O3 -Wall -frecord-gcc-switches It is very important to test and try different options with a representative data set. Often, different modules or objects can be compiled with different optimization flags in order to produce optimal results. Refer to Section 4.1.6.5, “Using Profile Feedback to Tune Optimization Heuristics.” for additional optimization tuning. 4.1.6.5.
Chapter 4. Compiling and Building 3. Recompile and optimize source.c with profiling information gathered in step one: gcc source.c -fprofile-use -O2 -o executable Multiple data collection runs, as seen in step two, will accumulate data into the profiling file instead of replacing it. This allows the executable in step two to be run multiple times with additional representative data in order to collect even more information.
Running GCC $ file hello64 hello64: ELF 64-bit LSB executable, x86-64, version 1 (GNU/Linux), dynamically linked (uses shared libs), for GNU/Linux 2.6.18, not stripped $ ldd hello64 linux-vdso.so.1 => (0x00007fff242dd000) libc.so.6 => /lib64/libc.so.6 (0x00007f0721514000) /lib64/ld-linux-x86-64.so.2 (0x00007f0721893000) The command file on a 64-bit executable will include ELF 64-bit in its output, and ldd will list /lib64/libc.so.6 as the main C library linked. 3. On a 64-bit system, compile hello.
Chapter 4. Compiling and Building Also important is to note that building with -m32 will in not adapt or convert a program to resolve any issues arising from 32/64-bit incompatibilities. For tips on writing portable code and converting from 32-bits to 64-bits, see the paper entitled Porting to 64-bit GNU/Linux Systems in the Proceedings of 6 the 2003 GCC Developers Summit . 4.1.7. GCC Documentation For more information about GCC compilers, refer to the man pages for cpp, gcc, g++, gcj, and gfortran.
Autotools Plug-in for Eclipse The Autotools suite's most commonly-used tools are: autoconf Generates the configure script from an input file (e.g. configure.ac) automake Creates the Makefile for a project on a specific system autoscan Generates a preliminary input file (i.e. configure.scan), which can be edited to create a final configure.ac to be used by autoconf All tools in the Autotools suite are part of the Development Tools group package.
Chapter 4. Compiling and Building If a configure.ac file is available instead, then autoconf will automatically create the configure script based on the macros invoked by configure.ac. To create a preliminary configure.ac, use the autoscan utility and edit the file accordingly. 4.3.3. Autotools Documentation Red Hat Enterprise Linux 6 includes man pages for autoconf, automake, autoscan and most tools included in the Autotools suite.
Chapter 5. Debugging Useful, well-written software generally goes through different phases of application development, and mistakes can occur in each phase. Some phases come with their own set of mechanisms to detect certain mistakes; during compilation, for example, most compilers perform elementary semantic analysis, making sure objects such as variables and functions are adequately described.
Chapter 5. Debugging not only the characteristics of each individual elements in the structure, but the morphology of the structure as well. GDB requires the following items in order to fully function: Debug Information Much of GDB's operations rely on a program's debug information. While this information generally comes from compilers, much of it is necessary only while debugging a program, i.e. it is not used during the program's normal execution.
Running GDB The execution of a stopped program can be resumed in a number of ways. The following are the most common. c (continue) The continue command simply restarts the execution of the program, which will continue to execute until it encounters a breakpoint, runs into a specified or emergent condition (e.g. an error), or terminates.
Chapter 5. Debugging Ensure that the resulting binary hello is in the same directory as hello.c. 2. Run gdb on the hello binary, i.e. gdb hello. 3. After several introductory comments, gdb will display the default GDB prompt: (gdb) 4. Some things can be done even before execution is started.
Conditional Breakpoints (gdb) n Hello, World! 9 return (0); The following sections describe more complex applications of GDB. 5.2.3. Conditional Breakpoints In many real-world cases, a program may perform its task well during the first few thousand times; it may then start crashing or encountering errors during its eight thousandth iteration of the task.
Chapter 5. Debugging 1 breakpoint keep y 0x080483f5 in main at iterations.c:8 stop only if i == 8936 breakpoint already hit 1 time 5.2.4. Forked Execution Among the more challenging bugs that can confront programmers is where one program (the parent) makes an independent copy of itself (a fork) that creates a child process which, in turn, fails.
Variable Tracking at Assignments Note Not all documented characteristics will apply to all instances of GDB because it is still in active development, and as such the capabilities vary (to some extent) depending on the platform and target for which it is built. 5.3. Variable Tracking at Assignments Variable Tracking at Assignments (VTA) is a new infrastructure included in GCC used to improve variable tracking during optimizations.
Chapter 5. Debugging To address this, the Red Hat Enterprise Linux 6 version of GDB is now compatible with Python prettyprinters. This allows the retrieval of more meaningful debugging data by leaving the introspection, printing, and formatting logic to a third-party Python script. Compatibility with Python pretty-printers gives you the chance to truly customize GDB output as you see fit.
Chapter 6. Profiling Developers profile programs to focus attention on the areas of the program that have the largest impact on performance. The types of data collected include what section of the program consumes the most processor time, and where memory is allocated. Profiling collects data from the actual program execution. Thus, the quality of the data collect is influenced by the actual tasks being performed by the program.
Chapter 6. Profiling Figure 6.2. Profile Configuration For more information on configuring and performing a profile run with each tool in Eclipse, refer to Section 6.2.3, “Valgrind Plug-in for Eclipse ”, Section 6.3.3, “OProfile Plug-in For Eclipse ”, and Section 6.5, “ Eclipse-Callgraph”. 6.2. Valgrind Valgrind is an instrumentation framework for building dynamic analysis tools that can be used to profile applications in detail.
Using Valgrind cachegrind Cachegrind is a cache profiler that accurately pinpoints sources of cache misses in code by performing a detailed simulation of the I1, D1 and L2 caches in the CPU. It shows the number of cache misses, memory references, and instructions accruing to each line of source code; Cachegrind also provides per-function, per-module, and whole-program summaries, and can even show counts for each individual machine instructions. callgrind Like cachegrind, callgrind can model cache behavior.
Chapter 6. Profiling • Memcheck • Massif • Cachegrind The Valgrind plug-in for Eclipse is provided by the eclipse-valgrind package. For more information about this plug-in, refer to Valgrind Integration User Guide in the Eclipse Help Contents. 6.2.4. Valgrind Documentation For more extensive information on Valgrind, refer to man valgrind.
Using OProfile oparchive The oparchive command generates a directory populated with executable, debug, and OProfile sample files. This directory can be moved to another machine (via tar), where it can be analyzed offline. opgprof Like opreport, the opgprof command outputs profile data for a given binary image from an OProfile session. The output of opgprof is in gprof format. For a complete list of OProfile commands, refer to man oprofile.
Chapter 6. Profiling Ease of Use The OProfile Plug-in provides generally useful defaults for all options, usable for a majority of profiling runs. In addition, it also features a "one-click profile" that executes a profile run using these defaults. Users can profile applications from start to finish, or select specific areas of code through a manual control dialog. The OProfile plug-in for Eclipse is provided by the eclipse-oprofile package.
SystemTap Compile Server The following sections describe new SystemTap features available in the Red Hat Enterprise Linux 6 release. 6.4.1. SystemTap Compile Server SystemTap in Red Hat Enterprise Linux 6 supports a compile server and client deployment. With this setup, the kernel information packages of all client systems in the network are installed on just one compile server host (or a few).
Chapter 6. Profiling • The module was compiled using the --unprivileged option. • The module meets the restrictions required for use by an unprivileged user. • The module has not been tampered with since it was created. 6.4.3. SSL and Certificate Management SystemTap in Red Hat Enterprise Linux 6 implements authentication and security via certificates and public/private key pairs. It is the responsibility of the system administrator to add the credentials (i.e.
Eclipse-Callgraph • SystemTap Beginner's Guide • SystemTap Tapset Reference • SystemTap Language Reference (documentation supplied by IBM) The SystemTap Beginner's Guide and SystemTap Tapset Reference are also available locally when you install the systemtap package: • file:///usr/share/doc/systemtap-version/SystemTap_Beginners_Guide/ index.html • file:///usr/share/doc/systemtap-version/SystemTap_Beginners_Guide.pdf • file:///usr/share/doc/systemtap-version/tapsets/index.
Chapter 6. Profiling Figure 6.3. Eclipse-Callgraph Profile After selecting an executable to profile, Eclipse-Callgraph will ask which files to probe. By default, all source files in the project will be selected.
The Callgraph View Figure 6.4. Selecting Files to Probe 6.5.2. The Callgraph View The Callgraph view's toolbar allows you to select a perspective and perform other functions. To play a visual representation of a function trace, click the View Menu button then navigate to Goto. This menu will allow you to pause, step through, or mark each function as it executes. Figure 6.5. View > Goto You can also save or load a profile run through the View Menu.
Chapter 6. Profiling Figure 6.6. Radial View The Radial View displays all functions branching out from main(), with each function represented as a node. A purple node means that the program terminates at the function. A green node signifies that the function call has nested functions, whereas gray nodes signify no nest functions. Double-clicking on a node will show its parent (colored pink) and children. The lines connecting different nodes also display how many times main() called each function.
The Callgraph View Tree View also includes a thumbnail viewer to help you navigate through different call depths of the function tree. Figure 6.8. Level View Level View displays all function calls and any nested function calls branching out from a selected node. However, Level View groups all functions of the same call depth together, giving a clearer visualization of a program's function call execution sequences.
Chapter 6. Profiling Figure 6.10. Aggregate View The Aggregate View depicts all functions as boxes; the size of each box represents a function's execution time relative to the total running time of the program. Darker-colored boxes represent functions that are called more times relative to others; for example, in Figure 6.10, “Aggregate View”, the CallThisThirtyTimes function is called the most number of times (150). Figure 6.11.
Perf Tool Commands switches. For example, PCL counters can compute the Instructions Per Clock (IPC) from a process's counts of instructions retired and processor clock cycles. A low IPC ratio indicates the code makes poor use of the CPU. Other hardware events can also be used to diagnose poor CPU performance. Performance counters can also be configured to record samples. The relative frequency of samples can be used to identify which regions of code have the greatest impact on performance. 6.6.1.
Chapter 6. Profiling The perf tool can also record samples. For example, to record data on the make command and its children, use: perf record -- make all This will print out the file in which the samples are stored, along with the number of samples collected: [ perf record: Woken up 42 times to write data ] [ perf record: Captured and wrote 9.753 MB perf.data (~426109 samples) ] You can then analyze perf.data to determine the relative frequency of samples.
ftrace 11.63%54959620202 8.60%40634845107 4.63%21864091080 2.73%12919672281 2.60%12271959697 2.41%11379910918 2.19%10340901937 libxml2.so.2.7.6 libxml2.so.2.7.6 libxml2.so.2.7.6 libxml2.so.2.7.6 libxml2.so.2.7.6 libxml2.so.2.7.6 libxml2.so.2.7.6 [.] [.] [.] [.] [.] [.] [.] xmlXPathNodeSetAdd__internal_alias xmlXPathCompOpEval xmlXPathReleaseObject xmlXPathNodeSetSort__internal_alias valuePop xmlXPathIsNaN__internal_alias valuePush__internal_alias 6.7.
Chapter 6. Profiling 6.7.2. ftrace Documentation The ftrace framework is fully documented in the following files: • ftrace - Function Tracer: file:///usr/share/doc/kernel-doc-version/Documentation/ trace/ftrace.txt • function tracer guts: file:///usr/share/doc/kernel-doc-version/Documentation/ trace/ftrace-design.
Appendix A. Revision History Revision 1.0 draft push Thu Oct 08 2009 Don Domingo ddomingo@redhat.
80
Index Symbols .
Index SystemTap, 67 compiling a C Hello World program usage GCC, 44 compiling a C++ Hello World program usage GCC, 45 compiling and building Autotools, 50 commonly-used commands, 51 configuration script, 51 documentation, 52 plug-in for Eclipse, 51 templates (supported), 51 distributed compiling, 50 GNU Compiler Collection, 39 documentation, 50 required packages, 43 usage, 43 introduction, 39 required packages, 50 specfile Editor, 52 plug-in for Eclipse, 52 conditional breakpoints GNU debugger, 57 configura
Ruby libraries and runtime support, 36 SystemTap profiling, 68 Valgrind profiling, 64 DTK (development toolkits) development toolkits Eclipse, 5 Dynamic Help Help system Eclipse, 5 E Eclipse development toolkits, 5 build integration, 6 C/C++ Development Toolkit, 5 CDT, 5 DTK (development toolkits), 5 hot patch, 6 Java Development Toolkit, 5 JDT, 5 Help system, 3 Contents (Help Contents), 4 Dynamic Help, 5 Menu (Help Menu), 4 Workbench User Guide, 5 integrated development environment, 7 Command Group Availa
Index function tracer profiling ftrace, 77 fundamental commands fundamentals GNU debugger, 54 fundamental mechanisms GNU debugger debugging, 53 fundamentals GNU debugger, 54 G gcc GNU Compiler Collection compiling and building, 39 GCC C usage compiling a C Hello World program, 44 GCC C++ usage compiling a C++ Hello World program, 45 GDB GNU debugger debugging, 53 gem2rpm Ruby libraries and runtime support, 36 glibc libraries and runtime support, 23 GNU C Library libraries and runtime support, 23 GNU C++ St
installation debuginfo-packages debugging, 53 integrated development environment Eclipse, 7 interfaces (added new) GNU C Library libraries and runtime support, 24 interfaces (CLI and machine) GNU debugger, 58 introduction compiling and building, 39 debugging, 53 Eclipse, 1 libraries and runtime support, 21 profiling, 61 SystemTap, 66 ISO 14482 Standard C++ library GNU C++ Standard Library libraries and runtime support, 26 ISO C++ TR1 elements, added support for GNU C++ Standard Library libraries and runtime
Index Java, 35 documentation, 35 KDE Development Framework, 32 Akonadi, 33 documentation, 34 KDE4 architecture, 32 kdelibs-devel, 32 KHTML, 33 KIO, 33 KJS, 33 KNewStuff2, 34 KXMLGUI, 33 Phonon, 33 Plasma, 32 Solid, 33 Sonnet, 33 Strigi, 33 Telepathy, 33 libhover, 17 Code Completion, 19 Eclipse, 17 Hover Help, 18 indexing, 17 usage, 18 libstdc++, 26 Perl, 37 documentation, 38 module installation, 37 updates, 37 Python, 34 documentation, 34 updates, 34 Qt, 31 documentation, 32 meta object compiler (MOC), 31 Q
new libraries Boost libraries and runtime support, 29 New Project Wizard projects Eclipse, 2 next tools GNU debugger, 55 O opannotate tools OProfile, 64 oparchive tools OProfile, 65 opcontrol tools OProfile, 64 Open MPI Boost libraries and runtime support, 29 opgprof tools OProfile, 65 opreport tools OProfile, 64 OProfile profiling, 64 documentation, 66 usage, 65 tools, 64 opannotate, 64 oparchive, 65 opcontrol, 64 opgprof, 65 opreport, 64 oprofiled OProfile profiling, 64 Outline Window user interface Ecli
Index oprofiled, 64 Performance Counters for Linux (PCL) and perf, 74 plug-in for Eclipse Eclipse-Callgraph, 69 SystemTap, 66 Valgrind, 62 Project Explorer user interface Eclipse, 8 projects Eclipse, 1 Python libraries and runtime support, 34 Python pretty-printers debugging, 59 Q Qt libraries and runtime support, 31 Qt Creator Qt libraries and runtime support, 32 qt-doc Qt libraries and runtime support, 32 Quick Access Menu integrated development environment Eclipse, 12 quick fix (Problems View) user inte
Boost libraries and runtime support, 28 subsystem (PCL) profiling Performance Counters for Linux (PCL) and perf, 74 supported templates Autotools compiling and building, 51 SystemTap compile server, 67 host (compile server host), 67 profiling, 66 documentation, 68 Eclipse-Callgraph, 69 introduction, 66 kernel information packages, 66 required packages, 66 scripts (SystemTap scripts), 66 SSL and certificate management, 68 automatic authorization, 68 connection authorization (compile servers), 68 module signi
Index V Valgrind profiling, 62 commands, 62 documentation, 64 plug-in for Eclipse, 63 tools, 62 usage, 63 tools cachegrind, 63 callgrind, 63 helgrind, 63 massif, 63 memcheck, 62 variable tracking at assignments (VTA) debugging, 59 variations and environments GNU debugger, 58 View Menu (button) user interface Eclipse, 9 View, Callgraph profiling Eclipse-Callgraph, 71 W widget toolkit Qt libraries and runtime support, 31 workbench integrated development environment Eclipse, 7 Workbench User Guide Help syste