
System information


Using the Profiler to Troubleshoot Performance Problems
Page 172 Identity Manager 7.1 Update 1 • Release Notes
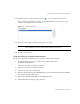
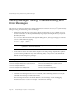
7. In the IDM Profiler view, click Take Snapshot.
After a few seconds, a snapshot should display in the Call Tree area. You should see that
/idm/task/workItemEdit.jsp
took six+seconds. (This result corresponds to the manual
action in the workflow.)
8. Expand the
/idm/task/workItemEdit.jsp
node and note that running all Derivations in
the ManualAction form took a total of six seconds.
9. Expand the
Derivation
,
displayNameForm
,
variables.dummy
, and
<block>
nodes.
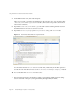
Figure 13 ProfilerTutorialWorkflow2 Snapshot Results
You should see that the
<block>
took six seconds and, of that time, the Profiler spent two
seconds in each of the three invokes to the
ProfilerTutorialExample.example()
. method.
10. You can double-click
<block>
to view the source.
• The following information should be provided as a Frequently Asked Questions (FAQ)
section at the end of Chapter 1, Using the Identity Manager IDE: (ID-16739)