
System information


Using the Profiler to Troubleshoot Performance Problems
Part Number 820-2952-10 Page 171
21. Click the Save the snapshot in the project icon to save your snapshot and close it.
If you check the Saved Snapshots section on the IDM Profiler tab, you should see your
snapshot. (You might have to scroll down.)
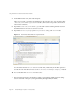
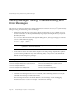
Figure 12 Saved Snapshots List
22.
Select the saved snapshot, and then click Open to re-open it.
23. Close the snapshot again.
Using the Profiler on a Workflow ManualAction
The next part of this tutorial illustrates how to profile a workflow ManualAction.
1. In Identity Manager, select Server Tasks > Run Tasks, and then click
ProfilerTutorialWorkflow2.
After a few moments, an empty form displays.
2. Click Save and the process diagram displays.
3. Select Server Tasks > Run Tasks again.
4. Return to the Identity Manager IDE IDM Profiler view and click the Reset Collected Results
icon in the Profiling Results section.
5. Now click ProfilerTutorialWorkflow2 in Identity Manager.
6. When the blank form displays again, click Save.
NOTE You can use the Save As button to save your snapshots externally and use
the Load button to load a snapshot from outside your project.