
System information

Using the Profiler to Troubleshoot Performance Problems
Page 170 Identity Manager 7.1 Update 1 • Release Notes
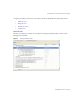
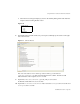
11. Expand
activity2
.
Note that
action1
took two seconds and
action2
took two seconds.
12. Expand
action1
and note that the
<invoke>
also took two seconds.
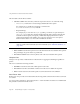
13. Double-click the
<invoke>
to open
ProfilerTutorialWorkflow1.xml
and highlight the
following line:
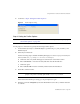
<invoke name='example' class='org.example.ProfilerTutorialExample'/>
You should see that a call to the
ProfilerTutorialExample
method took two seconds.
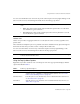
14. Select the CPU:<date><time> tab to return to your snapshot.
15. Expand the
<invoke>
node, and note that the Profiler spent two seconds in the Java
ProfilerTutorialExample.example()
method.
16. Double-click the method name to open the
ProfilerTutorialExample.java
source and
highlight the following line:
Thread.sleep(2000);
There's the problem! This method contains a two-second thread sleep.
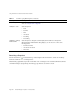
17. If you return to the Call Tree, you can see that all of the two second paths lead to this
method. (You should see three paths; for a total of six seconds.)
18. Select the Hotspots tab (located at the bottom of the Call Tree area) to open the Hotspots
view. Notice that
ProfilerTutorialExample.example()
has a total self time of six seconds.
(For more information about Hotspots, see “Hotspots View” on page 162.)
19. Right-click
ProfilerTutorialExample.example()
and select Show Back Traces from the
pop-up menu.
A new Back Traces tab displays at the bottom of the area.
20. Expand the
ProfilerTutorialExample.example()
node on the Back Traces tab to see that
this method was called from three places, and that the method took two seconds when it
was called from each place.
(For more information about Back Traces, see “Back Traces View” on page 162.)
NOTE You are actually browsing XML source that was captured in the snapshot,
rather than source in the project. Snapshots are completely self-contained.
(For more information, see “How the Profiler Locates and Manages Source”
on page 148.)